News analysis ·
Earnings season starts: how to read consensus growth
Forecasts call for nearly 30% profit growth as banks open earnings season. Learn what consensus, beats, revisions and forward P/E really measure.
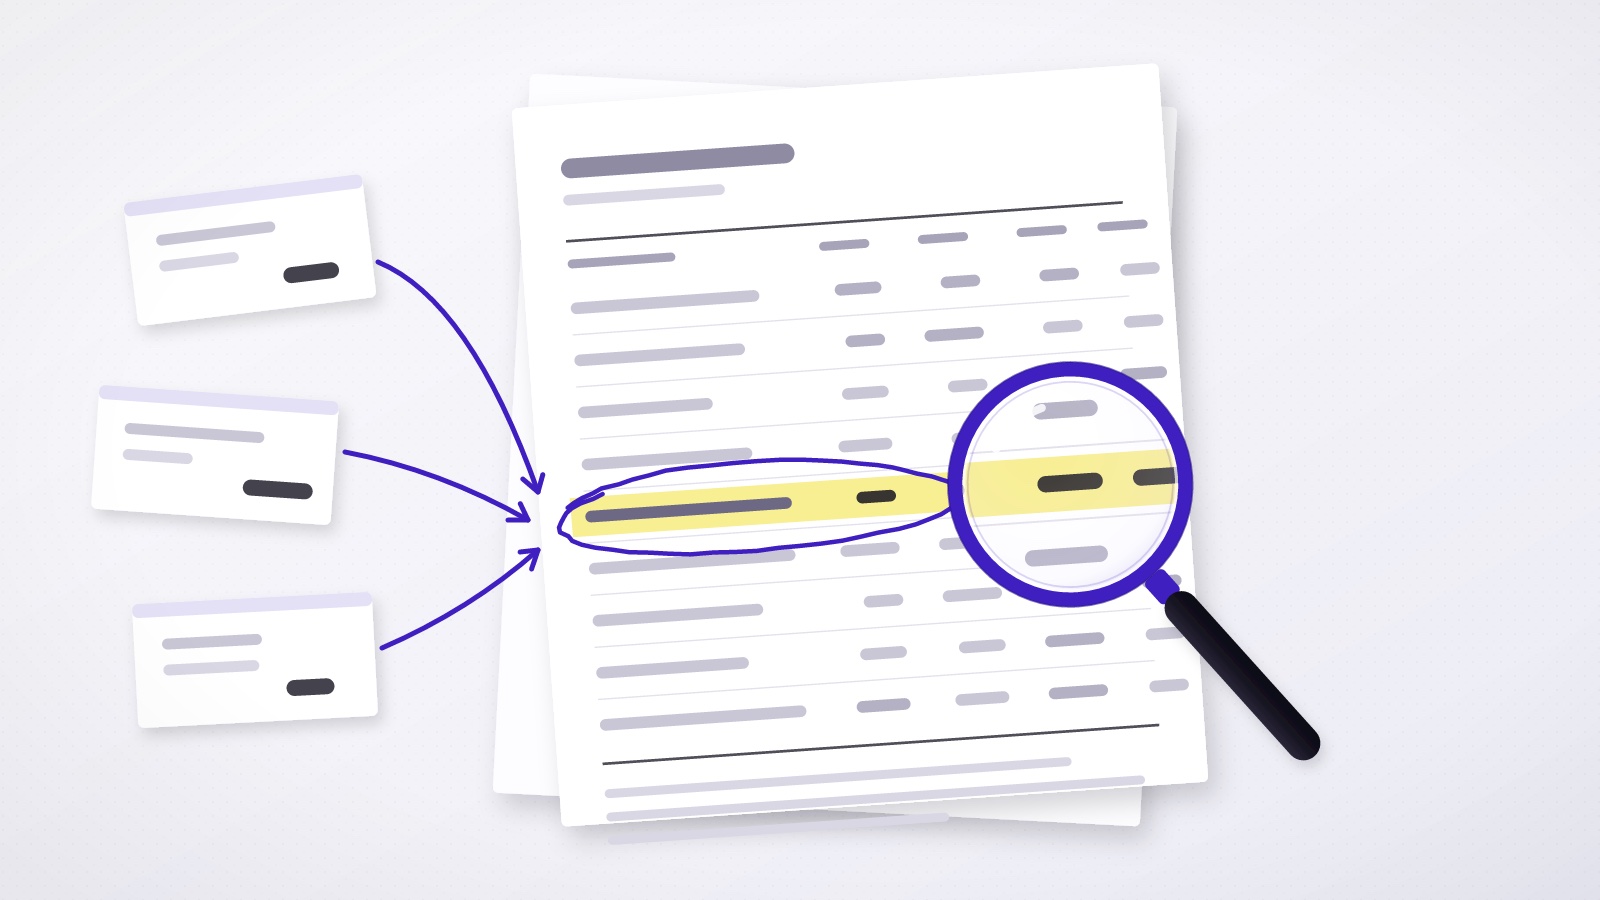
Third-quarter earnings season starts on Tuesday with JPMorgan Chase and other large banks, and analysts expect nearly 30% year-over-year profit growth, CNBC reported. At the same time, some strategists warn that beating forecasts may no longer be enough to move stocks. This article explains the numbers behind those headlines: consensus estimates, beats, revisions and the forward P/E ratio.
The headline in plain words
Companies in the S&P 500 are about to report how much they earned in the past three months. According to FactSet data cited by CNBC, the consensus calls for close to 30% growth versus the same quarter a year ago, up from about 27% three months earlier. Tech is expected to do the heavy lifting, with forecast profit growth of 65%, up from an estimated 57% three months ago.
Banks go first: Wells Fargo, Citigroup, Goldman Sachs and JPMorgan all report on Tuesday, and their results should show how higher interest rates are affecting lending, balance sheets, deal-making and IPOs. Taiwan Semiconductor, or TSM, reports on Thursday.
The numbers behind it
Four terms do most of the work in an earnings preview. Knowing them makes the coverage much easier to follow:
- Consensus estimate: the average forecast from the analysts who cover a company or index. FactSet and similar services collect these forecasts.
- Beat or miss: whether the reported figure came in above or below that consensus. A beat says the result was better than expected, not that it was good in absolute terms.
- Revision: a change to the consensus before results arrive. Upward revisions mean analysts raised forecasts; downward ones mean they cut them.
- Forward P/E: share price divided by expected earnings for the next twelve months. It shows how much investors pay today for each dollar of forecast profit.
These measures interact. If the consensus rises ahead of results, a company has a higher bar to clear. If the forward P/E falls while earnings forecasts rise, the price has not kept up with expected profits.
What the reports and strategists said
CNBC noted that S&P 500 quarterly profits have come in comfortably above estimates since mid-2023. Per FactSet, much of the tech forecast comes from higher estimates for three names: Dell Technologies, Micron Technology and Nvidia. Growth is also spreading: Russell Investments forecasts 27% year-over-year gains for the other 493 S&P 500 companies outside the so-called Mag 7. Ed Yardeni of Yardeni Research expects S&P 400 MidCap operating earnings to rise 19% in 2026.
On valuation, Lisa Shalett of Morgan Stanley Wealth Management said the forward multiple has slipped to 19 times, compared with 21 times during the summer. Bank of America took a more cautious view, saying the index looks expensive on 17 of 20 valuation measures, and it put the implied yearly return for the coming ten years at -3%. BofA expects 32% earnings growth this quarter, about a 3% beat versus consensus, but warned that "healthy beats are the status quo and may not be enough to drive stocks higher".
There are weaker spots too. Since June 30, eight sectors have seen bottom-up EPS estimates cut, led by materials at -10.2%, consumer staples at -4% and health care at -3.3%, according to FactSet. Close to 38% of the index's 504 members trade 20% or more below their 52-week high, a sign that gains are concentrated in a few areas. The financial sector sits near its 200-day moving average after falling 5% since August 31.
Reading one company: TSM as an example
The TSM numbers show how to read a single estimate. FactSet consensus for its third-quarter earnings per share has climbed from $3.42 in January to $4.45. That is a large upward revision, so the bar is now much higher than it was at the start of the year. TSM has topped forecasts in 19 of its last 20 quarters; in the second quarter it came in 10.8% above the consensus. A long record of beats is useful context, but it says nothing certain about the next report, and a stock can still fall after a beat if guidance disappoints.
How to check this yourself next time
You can follow the same logic for any company on a stock page or earnings calendar:
- Find the consensus EPS and revenue estimates, then note how they changed over the past three months to see whether the bar has risen or fallen.
- When results arrive, compare reported EPS with the consensus, then read the company's guidance, which often matters more than the beat itself.
- Check the forward P/E before and after the report to see whether the price moved faster or slower than expected earnings.
Keep in mind that estimates are forecasts, not facts. Stocks can move sharply in either direction after results, and anyone who invests can lose money.
Sources
- CNBC, 12 Oct 2026
AI-drafted from the filings and reports above, then published automatically after checks that each number appears in a cited source and that no wording is copied. There was no human edit. Educational reading only, not a recommendation on any stock.