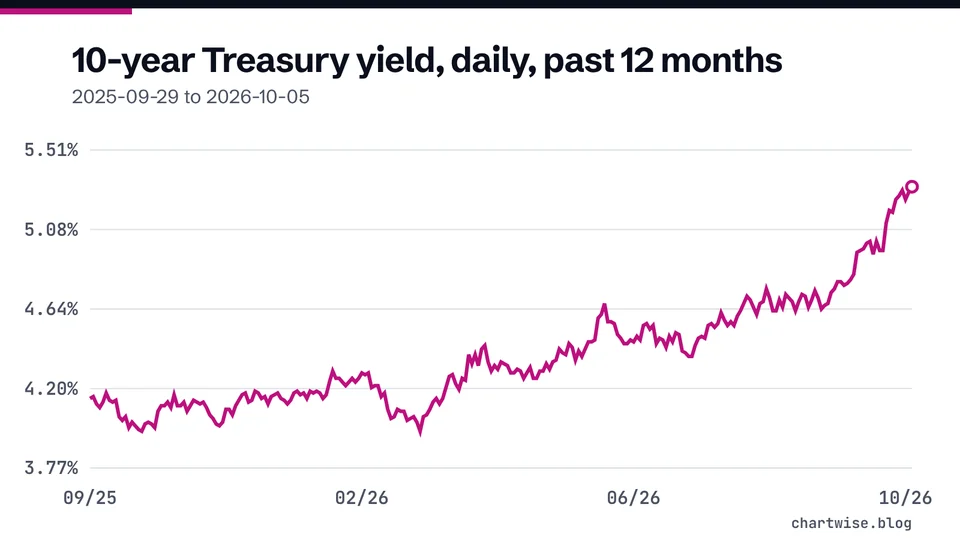
Start with this
Stock Charts8 min read
How to read a stock chart for beginners
The parts of a stock chart, the three main chart types, why the time frame and scale change the story, and what a chart can never tell you.
Read the explainerEducation, not investment advice. Stocks can lose value. How we check every number
Topic
A stock chart is a record of prices people already paid. Learn to read it accurately, and learn exactly where its usefulness ends.
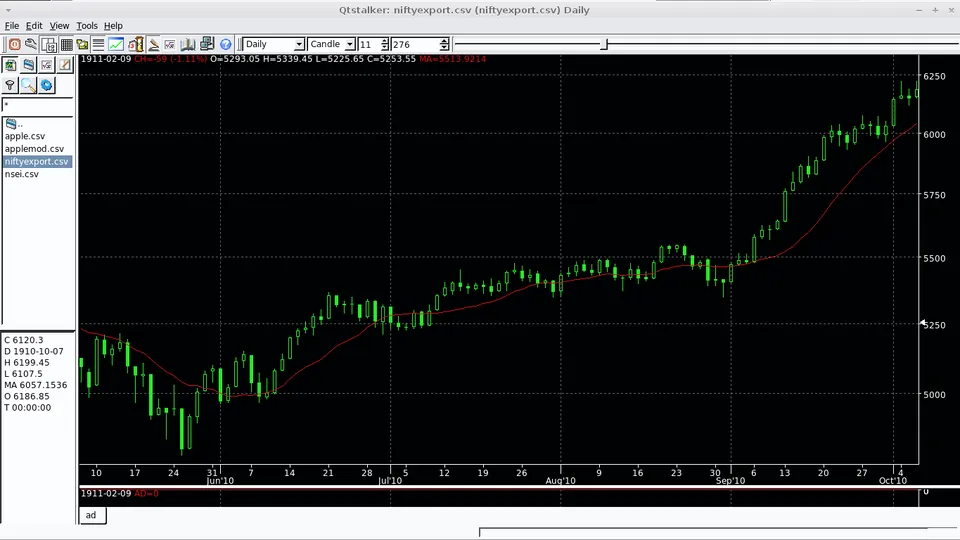
Every stock page has a chart, and most beginners look at it first. This topic teaches you to read one the way you would read a table of numbers: carefully, in a fixed order, and without guessing at what it means for the future. The SEC puts the limit plainly: past performance cannot predict how an investment strategy will perform in the future [1].
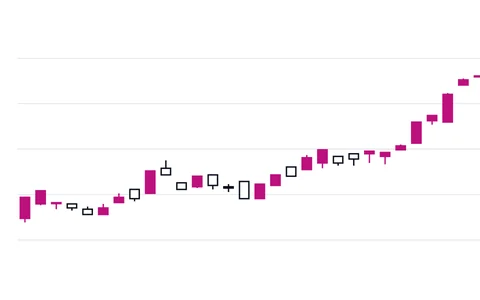
Start with how to read a stock chart. It covers the price and time axes, the three main chart types, why the time window and the price scale can change the story, and how a stock split can look like a crash. Then learn what sits inside each period with candlestick charts, which pack the open, high, low and close into one shape [2].
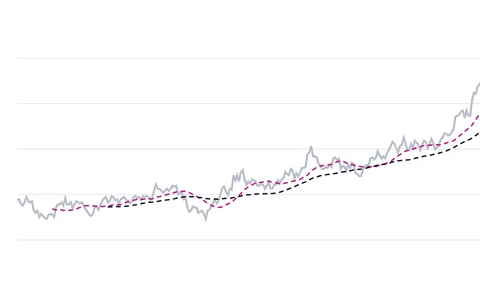
Moving averages explained works through a simple moving average day by day and shows why the 50-day and 200-day lines always lag the price. Support and resistance explains the price levels traders draw on charts and what they are not. Technical indicators and ratings explains the "Strong Buy" or "Sell" summaries some quote sites show next to a chart, and why they are not advice.
Short definitions live in the glossary: bull market, bear market and market correction. If you size trades with a stop price, the position size calculator works out how many shares fit the amount you plan to risk.
Worked examples use hypothetical stocks calculated in code, never live prices or trading signals, and definitions and rules link to primary sources such as the SEC, FINRA and CME Group.
Start with this
Stock Charts8 min read
The parts of a stock chart, the three main chart types, why the time frame and scale change the story, and what a chart can never tell you.
Read the explainerStock Charts6 min read
How to read the body and wicks of a candlestick, what green, red, white and black mean, how time frames work and what named patterns can and cannot tell you.
Stock Charts6 min read
How a simple moving average is worked out, how the exponential version differs, what the 50-day and 200-day lines show and why every moving average lags.
Stock Charts7 min read
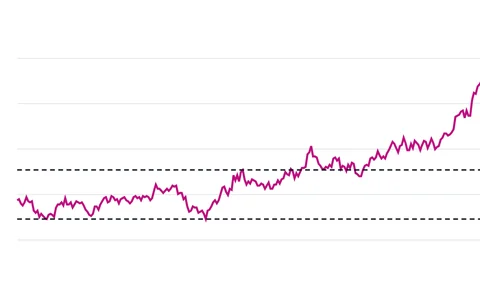
How traders draw support and resistance, why levels are zones rather than exact prices, and what a New York Fed study of currency markets found when it tested them.
Stock Charts7 min read
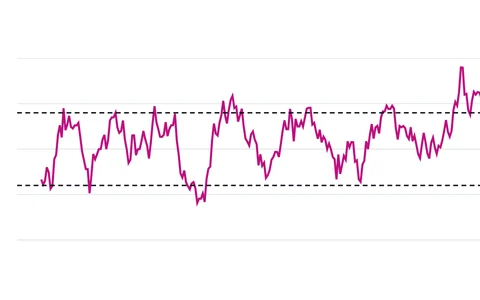
A "Strong Buy" technical summary is a vote count from moving averages and oscillators. How it is built, why it changes with the time frame, and what it is not.
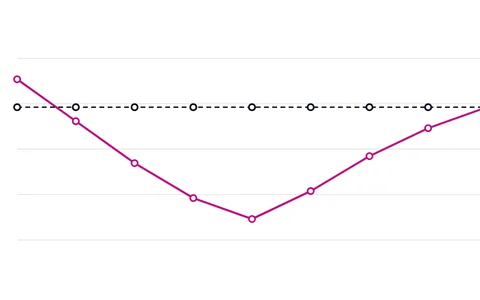 +20% FROM THE LOW
A bull market is a period of rising stock prices, generally a rise of 20% or more in a broad index. What the SEC definition says, with a real example.
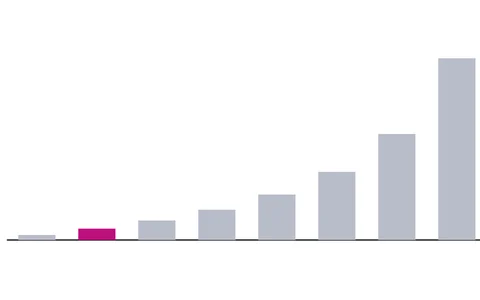 LOSS VS GAIN NEEDED
A bear market is a period of falling stock prices, generally a drop of 20% or more in a broad index. The definition, the 2020 example and the recovery math.
 LOSS VS GAIN NEEDED
A market correction is a reversal of at least 10% in a stock, index or other market. How it differs from a bear market, with a calculated example.
The time window and the chart type. The same stock can be up over a year and down over three months, and a line chart shows only closing prices [3]. Read how to read a stock chart first.