A stock page on Yahoo Finance, Google Finance or investing.com can look like a wall of numbers. This topic takes that wall apart one line at a time. Some lines describe how the stock is trading right now: last price, change, bid and ask, day's range and volume. Others describe the company: market cap, P/E and dividend yield. None of them is a signal to buy or sell, and any stock can lose money [1].
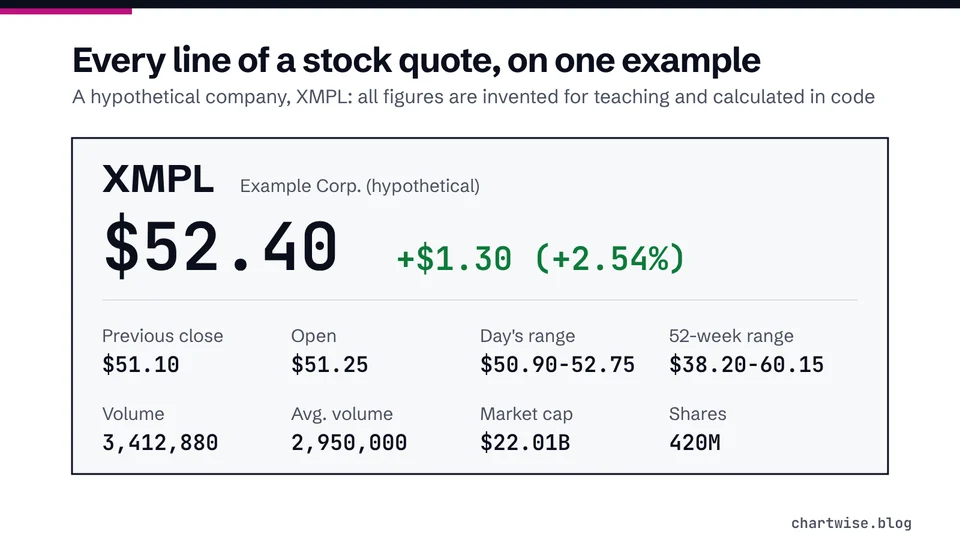
Start with how to read a stock quote, which walks through a full quote box for a hypothetical company in reading order. Then go deeper on the lines beginners misread most often.
Market cap explained shows why share price says nothing about company size, where the share count comes from and what labels like large-cap and microcap mean. Volume and average volume explains how trading volume is counted and why thinly traded stocks can be hard to sell. The bid-ask spread covers the gap between buying and selling prices, and pre-market and after-hours trading explains the prices you see outside the 9:30 a.m. to 4:00 p.m. Eastern Time regular session [2].
Every explainer uses invented example companies calculated in code, never live prices or ratings, and links each rule and number to a primary source such as the SEC, FINRA or an exchange.
The formula, a worked example, where the share count comes from, what large-cap and microcap mean, and why index providers use float-adjusted market cap.
A ticker symbol is the short code that identifies a stock. What the letters mean, what a suffix like Q tells you, and why checking the company name matters.
Volatility is how much a stock's price swings up and down. How index providers measure it, what the VIX is, and why it matters for money you need soon.
Beta compares how a stock has moved with how the market moved. What 1.2 or 0.85 means, how index providers calculate it, and what beta does not tell you.
Questions people ask about this topic
What should I look at first on a stock page?
The last price, whether it is delayed, and the change from the previous close. A delayed quote can lag 15 and sometimes 20 minutes [3]. Read how to read a stock quote first.
Does a lower share price mean a smaller or cheaper company?
No. Company size is market cap: share price multiplied by shares outstanding [4]. A low price can belong to a very large company.
Can a stock page tell me whether to buy?
No. The numbers describe trading and the company. They are not ratings, and there is no guarantee a company will grow [1].
Sources
Stocks - FAQs. U.S. Securities and Exchange Commission (Investor.gov).