Explainer · Company Fundamentals
Earnings per share (EPS) explained
Earnings per share divides a company's profit by its shares, so you can see how much of the bottom line belongs to each one. It is simple to calculate and easy to misread.
Quick answer
Earnings per share (EPS) is a company's net income divided by its common shares [5]. Basic EPS uses shares outstanding; diluted EPS adds shares that options, stock awards and convertible securities could create [6] [5]. It appears on the face of the income statement [4].
Key points
- EPS = net income, minus any preferred dividends, divided by common shares [5].
- Companies divide by the weighted average number of shares outstanding during the period, not the count on the last day [6].
- Diluted EPS spreads profit over more shares, so it is the cautious figure; for Microsoft's fiscal 2026 it was $17.95 against $18.00 basic [6].
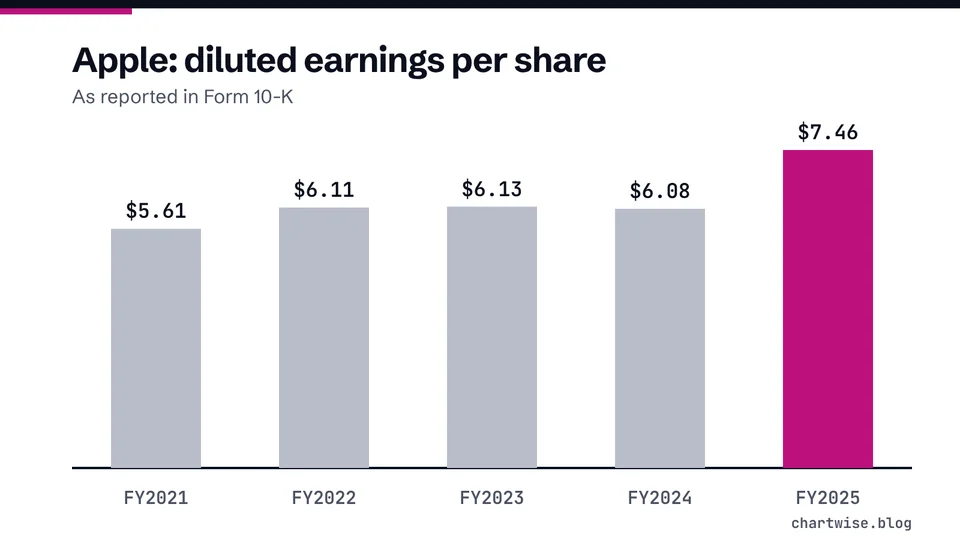
- EPS can grow faster than net income when the share count falls: Apple's diluted EPS rose 21.7% from fiscal 2023 to 2025 while net income rose 15.48% (calculated).
- One-time items can swing EPS hard, so check continuing operations and the notes before comparing years.
On this page
What is earnings per share?#
Earnings per share, or EPS, is the portion of a company's net income allocated to each share of outstanding common stock [1]. The SEC describes it as how much money shareholders would receive for each share they own if the company distributed all of its net income for the period [2]. Companies rarely do that, so treat EPS as a measuring stick, not a payment.
Why divide by shares at all? Because total profit says nothing about your slice. FINRA notes that EPS lets you compare the financial results of companies of different sizes [3]. Take two hypothetical companies: one earns $10 billion with 10 billion shares, the other $1 billion with 100 million shares. The first has ten times the profit, but its EPS is $1 against $10 for the second (calculated).
You will find EPS on the income statement itself. The SEC's Regulation S-X lists earnings per share data among the line items that should appear on the face of the statement [4]. If you are new to that statement, read how to read an income statement first.
How do you calculate EPS?#
EPS = (net income - preferred dividends) / weighted average common shares
FINRA's example: a company with net income of $100 million and 50 million shares has EPS of $2 [5]. If the company also has preferred stock, the dividends paid on those shares are subtracted from net income before dividing [5].
The share count is an average across the period. Microsoft's 10-K states that basic EPS is computed on the weighted average number of common shares outstanding during the period [6]. Shares issued or bought back halfway through the year count for only part of it.
- Find net income
Take the bottom line of the income statement for the period: a quarter from the 10-Q or a fiscal year from the 10-K.
- Divide by the weighted average share count
Use the shares used in computing earnings per share, shown on the income statement [7], not today's count from a quote page.
- Check your answer against the filing
Microsoft's fiscal 2026 net income of $133,749 million divided by 7,453 million diluted shares gives $17.95 (calculated), matching the diluted EPS in its 10-K [6].
What is the difference between basic and diluted EPS?#
Basic EPS counts only shares that are issued and outstanding. Diluted EPS adds the common stock equivalent of other securities [1], such as convertible bonds, options and warrants, as if they had been turned into shares [5]. Microsoft lists its dilutive potential shares as outstanding stock options and stock awards, and adds them using the treasury stock method [6].
More shares in the denominator means a smaller figure, so diluted EPS is the cautious number. For the four companies below the gap was under 1% (calculated). They are shown for their latest fiscal year, as reported in each Form 10-K.
| Company and fiscal year | Basic EPS | Diluted EPS | Diluted vs basic |
|---|---|---|---|
| Apple, fiscal 2025 | $7.49 | $7.46 | -0.40% |
| Microsoft, fiscal 2026 | $18.00 | $17.95 | -0.28% |
| Coca-Cola, 2025 | $3.05 | $3.04 | -0.33% |
| Johnson & Johnson, fiscal 2025 | $11.13 | $11.03 | -0.90% |
EPS as reported in each company's Form 10-K [7] [6] [8] [9]. Last column calculated.
Why can EPS grow faster than net income?#
Because EPS has two moving parts. If the number of shares falls, each share gets a bigger slice of the same profit. Apple shows the effect clearly. As reported in its Form 10-K, net income rose from $96,995 million in fiscal 2023 to $112,010 million in fiscal 2025, while diluted shares fell from 15,812,547 thousand to 15,004,697 thousand [7]. Diluted EPS went from $6.13 to $7.46 [7].
Apple's 10-K also reports that on May 1, 2025 it announced an additional program to repurchase up to $100 billion of its common stock [10]. Whatever the reason a share count falls, the lesson is the same: when you compare EPS growth, also compare net income growth. If EPS is growing much faster, the share count is doing part of the work. See the Apple company page for the filing figures.
Why did Johnson & Johnson's EPS swing so much?#
Johnson & Johnson's diluted EPS was $13.72 in fiscal 2023, $5.79 in 2024 and $11.03 in 2025, as reported in its Form 10-K [9]. The 2023 figure is not comparable with the others. Its income statement splits that $13.72 into $5.20 from continuing operations and $8.52 from discontinued operations [9], which relate to the Kenvue separation [11].
Compare continuing operations with continuing operations and the story changes: $5.20 in 2023, $5.79 in 2024 and $11.03 in 2025 [9]. A quote page that shows one EPS number per year cannot tell you this. The Johnson & Johnson company page has the filing figures.
What is adjusted EPS?#
Some earnings releases lead with "adjusted" or non-GAAP EPS. Under Regulation G, a non-GAAP measure is one that excludes amounts included in the most directly comparable figure calculated under GAAP, or includes amounts that figure leaves out [12]. When a company publishes one, it must also present the comparable GAAP measure and a reconciliation of the differences [12], and the measure must not be misleading [12].
Adjusted EPS is the figure management chooses to highlight, built from adjustments the company itself selects. Read the reconciliation line by line and ask whether each excluded item really will not come back.
Mistakes beginners make with EPS#
- Comparing EPS across companies as if it were a score
EPS depends on how many shares a company has. A $2 EPS is not worse than an $18 EPS; it only means profit is split across more shares. Use the P/E ratio to relate EPS to price.
- Mixing basic and diluted
Pick one, preferably diluted, and use it for every year and every company you compare [6].
- Ignoring the share count
EPS can rise while net income is flat if shares fall. Check net income growth next to EPS growth.
- Taking adjusted EPS without the reconciliation
Non-GAAP EPS leaves out, or adds, amounts compared with GAAP EPS [12]. Read what was removed before you use it.
Frequently asked questions#
Can earnings per share be negative?
Yes. If a company has a net loss, EPS is the loss divided by the shares, so it is negative. The SEC's example labels the bottom line "net income (loss)" for this reason [1].
Which EPS should I use, basic or diluted?
Where can I find a company's EPS?
Is a higher EPS always better?
Not on its own. Higher EPS from growing profit is different from higher EPS caused by a smaller share count or a one-time gain. Look at net income, share count and the notes together.
The bottom line#
EPS is net income divided by shares, and both halves can move. Use diluted EPS from the filing, compare it with net income growth, separate continuing operations from one-time items, and read the reconciliation behind any adjusted figure. Then see how the market prices those earnings in our P/E ratio explainer, or try the numbers yourself in the P/E ratio calculator.
Sources
- What is an income statement?.
- Beginners' Guide to Financial Statements.
- Evaluating Stocks.
- 17 CFR 210.5-03 Statements of comprehensive income.
- Financial Performance Metrics Every Investor Should Know.
- EARNINGS PER SHARE (Microsoft Corporation Form 10-K for the fiscal year ended June 30, 2026, R12).
- CONSOLIDATED STATEMENTS OF OPERATIONS (Apple Inc. Form 10-K for the fiscal year ended September 27, 2025, R3).
- CONSOLIDATED STATEMENTS OF INCOME (The Coca-Cola Company Form 10-K for the fiscal year ended December 31, 2025, R3).
- Consolidated Statements of Earnings (Johnson & Johnson Form 10-K for the fiscal year ended December 28, 2025, R5).
- Apple Inc. Form 10-K for the fiscal year ended September 27, 2025.
- Kenvue separation and discontinued operations (Johnson & Johnson Form 10-K for fiscal 2025, R31).
- 17 CFR Part 244 Regulation G.
- How to Read a 10-K/10-Q | Investor.gov.
Education only. This page is not investment, tax or legal advice. Stocks can lose value. See our risk disclosure.