Behind every share price is a company that reports its sales, costs and profit to the SEC. Learn to read those numbers yourself, starting with the income statement.
5 explainers
5 glossary terms
35 min of reading
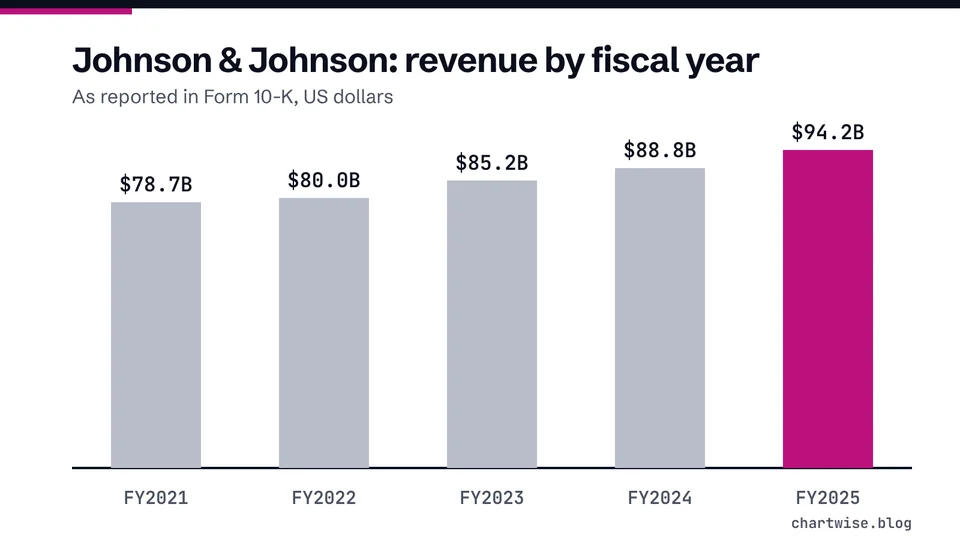
Chart: ChartWise, from SEC EDGAR XBRL data for JOHNSON & JOHNSON (Form 10-K), downloaded 2026-10-06. CC BY 4.0. Illustration only, not a forecast.
US public companies file their results with the SEC: an annual report on Form 10-K, with audited financial statements, and a 10-Q after each of the first three fiscal quarters [1]. The SEC counts four main financial statements: the balance sheet, the income statement, the cash flow statement and the statement of shareholders' equity [2]. This topic teaches you to read them and to understand the ratios a stock page builds from them.
Start with how to read an income statement. It walks from revenue down to net income, the bottom line, using the SEC's own worked example and real figures from Apple, Coca-Cola and Johnson & Johnson filings. Then read earnings per share explained, which divides that bottom line by the number of shares and shows why basic and diluted EPS differ.
Short definitions live in the glossary: revenue, net income, free cash flow, EBITDA and fiscal year. Company figures on these pages come from filings on the SEC's EDGAR system, and every share price used in examples is hypothetical. Nothing here says whether any stock is worth buying, and stocks can lose value.
Read an income statement from revenue down to net income and earnings per share, with the SEC's worked example and Apple's fiscal 2025 figures from its 10-K.
Assets minus liabilities, divided by shares. How book value per share and the P/B ratio are calculated, real balance sheets from 10-K filings, and the traps in a low P/B.
Gross, operating and net margins, return on equity, and why a sky-high ROE can come from a thin balance sheet. Formulas, real 10-K figures and common mistakes.
Revenue is the money a company earns from selling its goods and services in a period. Where it sits in a 10-K, how it is counted, and why it is not profit.
Net income is the profit left after a company subtracts all expenses, interest and taxes from revenue. How to find it in a 10-K and how it feeds EPS and P/E.
Free cash flow is usually operating cash flow minus capital expenditures. How to calculate it from a 10-K, why definitions differ, and a Microsoft example.
EBITDA is earnings before interest, taxes, depreciation and amortization. How to calculate it from net income, what it leaves out, and Adjusted EBITDA.
A fiscal year is the 12-month period a company uses for its annual reports. Why Apple's and Microsoft's years end in different months, and why it matters.
Questions people ask about this topic
Where can I find a company's financial statements for free?
All 10-Ks and 10-Qs filed with the SEC are public on the SEC's EDGAR website [1]. The income statement is in the financial statements section of each filing.
Which financial statement should a beginner read first?
The income statement, because EPS and the P/E ratio are built from its bottom line. Start with how to read an income statement.
Can fundamentals tell me which stock to buy?
No. They describe what a company has already reported, not what its shares will do next. ChartWise does not give buy or sell recommendations.