Explainer · Company Fundamentals
The P/E ratio explained, with real filings
The P/E ratio tells you how many dollars investors are paying for each dollar of a company's earnings. The price half is easy to find; the earnings half is where most mistakes happen.
Quick answer
The price-to-earnings (P/E) ratio is the share price divided by earnings per share, usually the past 12 months of earnings [1]. It shows how much investors pay for a dollar of earnings [2]. Compare it only with similar companies, because average ratios vary across industries [2].
Key points
- P/E = share price / earnings per share [1].
- A P/E of 20 means the price is 20 times the earnings per share the formula uses (calculated: $50 / $2.50).
- The same price gives very different P/E ratios depending on which EPS you divide by: annual or trailing, basic or diluted, GAAP or adjusted, with or without one-time items.
- A forward P/E uses forecast earnings [6], which may not arrive.
- A low P/E is not automatically good value; FINRA warns that not every low-P/E stock represents true value [13].
On this page
What is the P/E ratio?#
The price-to-earnings ratio compares a company's share price with its earnings per share. Investor.gov defines it as the current stock price divided by the current earnings per share, where EPS is the earnings for the past 12 months divided by the common shares outstanding [1]. FINRA calls it a commonly quoted measure of stock value [2].
The plain-English reading: P/E tells you how much investors are paying for a dollar of a company's earnings [2]. FINRA's example compares Company A with a P/E of 25 and Company B with a P/E of 20: investors are paying more for each dollar earned by A than by B [2]. Investor.gov adds that P/E is a way to gauge whether a price is high or low compared with the past or with other companies [1].
How do you calculate a P/E ratio from a company's filing?#
P/E = share price / earnings per share
- Find EPS on the income statement
Earnings per share data is one of the line items on the face of the income statement [3]. Our guide to earnings per share explains basic and diluted EPS.
- Decide which 12 months
Investor.gov's definition uses the past 12 months [1]. That may be the last fiscal year from the 10-K, or the last four quarters added together.
- Take a share price
For a trailing P/E, use today's price. In the examples here we use hypothetical prices.
- Divide, then check the inputs
Write down which EPS you used. A P/E without its EPS source cannot be compared with anyone else's.
- Share price
- $50hypothetical example
- EPS, last 12 months
- $2.50hypothetical example
- Trailing P/E
- 20calculated: $50 / $2.50
- Earnings yield
- 5%calculated: $2.50 / $50
Why can the P/E change when the price does not?#
Because the denominator moves. Johnson & Johnson's real diluted EPS, as reported in its Form 10-K, was $13.72 in fiscal 2023, $5.79 in 2024 and $11.03 in 2025 [4]. The 2023 figure includes $8.52 per share from discontinued operations, leaving $5.20 from continuing operations [4]. The table holds a hypothetical price of $150 constant and divides it by each EPS.
| EPS used | Diluted EPS | P/E at a hypothetical $150 |
|---|---|---|
| Fiscal 2023, total | $13.72 | 10.93 |
| Fiscal 2023, continuing operations | $5.20 | 28.85 |
| Fiscal 2024 | $5.79 | 25.91 |
| Fiscal 2025 | $11.03 | 13.60 |
EPS as reported in Johnson & Johnson's Form 10-K for fiscal 2025 [4]. The $150 price is hypothetical; P/E calculated.
Using the 2023 total EPS, the stock would trade at a low 10.93 times earnings (calculated). Using only continuing operations, the same price is 28.85 times earnings (calculated). Nothing about the company changed between those two rows; only the EPS you chose did. The 2023 gain relates to the Kenvue separation [5], and you can see the filing figures on the Johnson & Johnson company page.
What is the difference between trailing and forward P/E?#
A trailing P/E divides today's price by the most recent 12 months of earnings. A forward P/E, which Nasdaq's glossary calls price to prospective earnings, divides it by consensus forecast earnings for the next 12 months [6]. Trailing earnings have been reported; forward earnings are estimates.
In our hypothetical example, if analysts forecast next-year EPS of $2.75, the forward P/E at $50 is 18.18 (calculated). If the forecast were $2.25 instead, the forward P/E would be 22.22 (calculated). The stock and its price are identical in both cases. A forward P/E is only as good as the forecast inside it, and forecasts can be wrong in either direction.
Which EPS should go into a P/E ratio?#
There is no single answer, which is one reason two websites may show different P/E ratios for the same stock at the same price. The choices are:
Basic or diluted. Diluted EPS counts shares that options and awards could create [7]. At a hypothetical $200 price, Apple's fiscal 2025 basic EPS of $7.49 gives a P/E of 26.70 and its diluted EPS of $7.46 gives 26.81 (calculated; EPS from its 10-K [8]).
GAAP or adjusted. Adjusted EPS leaves out, or adds, amounts compared with GAAP EPS [9], so a P/E built on it may not be comparable with one built on the 10-K figure.
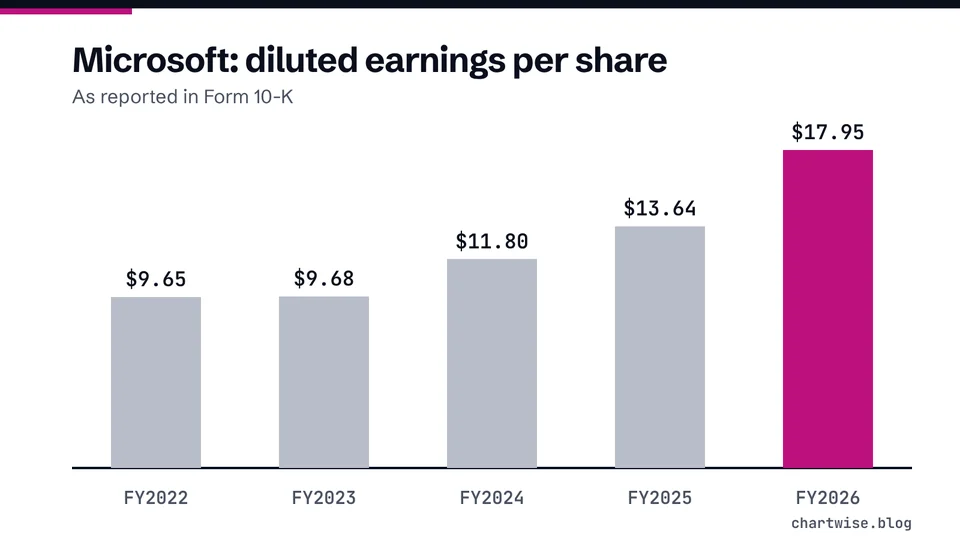
Fiscal year or last four quarters. Fiscal years end on different dates: Apple's on the last Saturday of September [10], Microsoft's fiscal 2026 on June 30, 2026 [11]. A P/E built on an old fiscal year can be many months stale. Quote pages may not say which EPS they use, so when it matters, calculate the ratio yourself from the filing. Our guide on how to read a stock quote shows where P/E sits on a typical quote page.
What can a P/E ratio tell you, and what can't it?#
It can tell you how the market is pricing the company's earnings relative to others. FINRA advises comparing ratios with the market as a whole and with the company's own industry, since average ratios can vary significantly across industries [2]. S&P Dow Jones Indices uses the earnings to price ratio, the inverse of P/E, as one of three value factors in its US style indices [12].
It cannot tell you whether a stock is a bargain. FINRA notes that not every stock with a low P/E represents true value [13]; a stock may look cheap while some market participants avoid it because they see reduced prospects [13]. P/E also breaks down when earnings are negative: dividing a price by a loss gives a negative number that does not describe a price per dollar of earnings, which is why our calculator shows "not meaningful" for a loss. For a second, asset-based view, see book value and the price-to-book ratio.
Mistakes beginners make with the P/E ratio#
- Comparing P/E across unrelated industries
Average ratios vary significantly between industries [2]. Compare a company with its peers and its own history.
- Treating a low P/E as a bargain
Not every low-P/E stock represents true value [13]. Earnings can be about to fall, or inflated by a one-time gain.
- Ignoring one-time items in EPS
Johnson & Johnson's 2023 EPS included $8.52 per share from discontinued operations [4]. A P/E built on it looks far lower than one built on continuing operations.
- Mixing trailing and forward P/E
One uses reported earnings, the other forecasts [6]. Comparing a trailing P/E with a forward P/E mixes two different things.
- Not knowing which EPS a website used
Basic or diluted, GAAP or adjusted, fiscal year or last four quarters. When in doubt, recalculate from the 10-K or 10-Q.
Frequently asked questions#
What is a good P/E ratio?
Can a P/E ratio be negative?
Mathematically yes, if EPS is negative. But a P/E based on a loss does not describe a price per dollar of earnings, so our P/E ratio calculator labels it not meaningful.
What does a P/E of 20 mean?
The share price is 20 times the earnings per share used in the calculation. In our hypothetical example, a $50 stock with $2.50 of EPS has a P/E of 20 and an earnings yield of 5% (calculated).
Is forward P/E more accurate than trailing P/E?
Not necessarily. Trailing P/E uses reported earnings; forward P/E uses consensus forecasts for the next 12 months [6], which can turn out wrong.
The bottom line#
A P/E ratio is only as good as the EPS inside it. Take EPS from the filing, write down whether it is trailing or forward, basic or diluted, GAAP or adjusted, and check for one-time items before you compare. Compare within an industry, never treat a low number as a verdict, and try your own inputs in the P/E ratio calculator.
Sources
- Price-earnings (P/E) Ratio.
- Evaluating Stocks.
- 17 CFR 210.5-03 Statements of comprehensive income.
- Consolidated Statements of Earnings (Johnson & Johnson Form 10-K for the fiscal year ended December 28, 2025, R5).
- Kenvue separation and discontinued operations (Johnson & Johnson Form 10-K for fiscal 2025, R31).
- Trailing Earnings.
- EARNINGS PER SHARE (Microsoft Corporation Form 10-K for the fiscal year ended June 30, 2026, R12).
- CONSOLIDATED STATEMENTS OF OPERATIONS (Apple Inc. Form 10-K for the fiscal year ended September 27, 2025, R3).
- 17 CFR Part 244 Regulation G.
- Apple Inc. Form 10-K for the fiscal year ended September 27, 2025.
- Microsoft Corporation Form 10-K for the fiscal year ended June 30, 2026.
- S&P U.S. Style Indices Methodology.
- Value Investing.
Education only. This page is not investment, tax or legal advice. Stocks can lose value. See our risk disclosure.