News analysis ·
Home Depot's Beat: Reading Comparable Sales and EPS
Home Depot beat estimates and named a new CEO. We explain comparable sales, reported versus adjusted EPS and how to read its narrowed guidance.
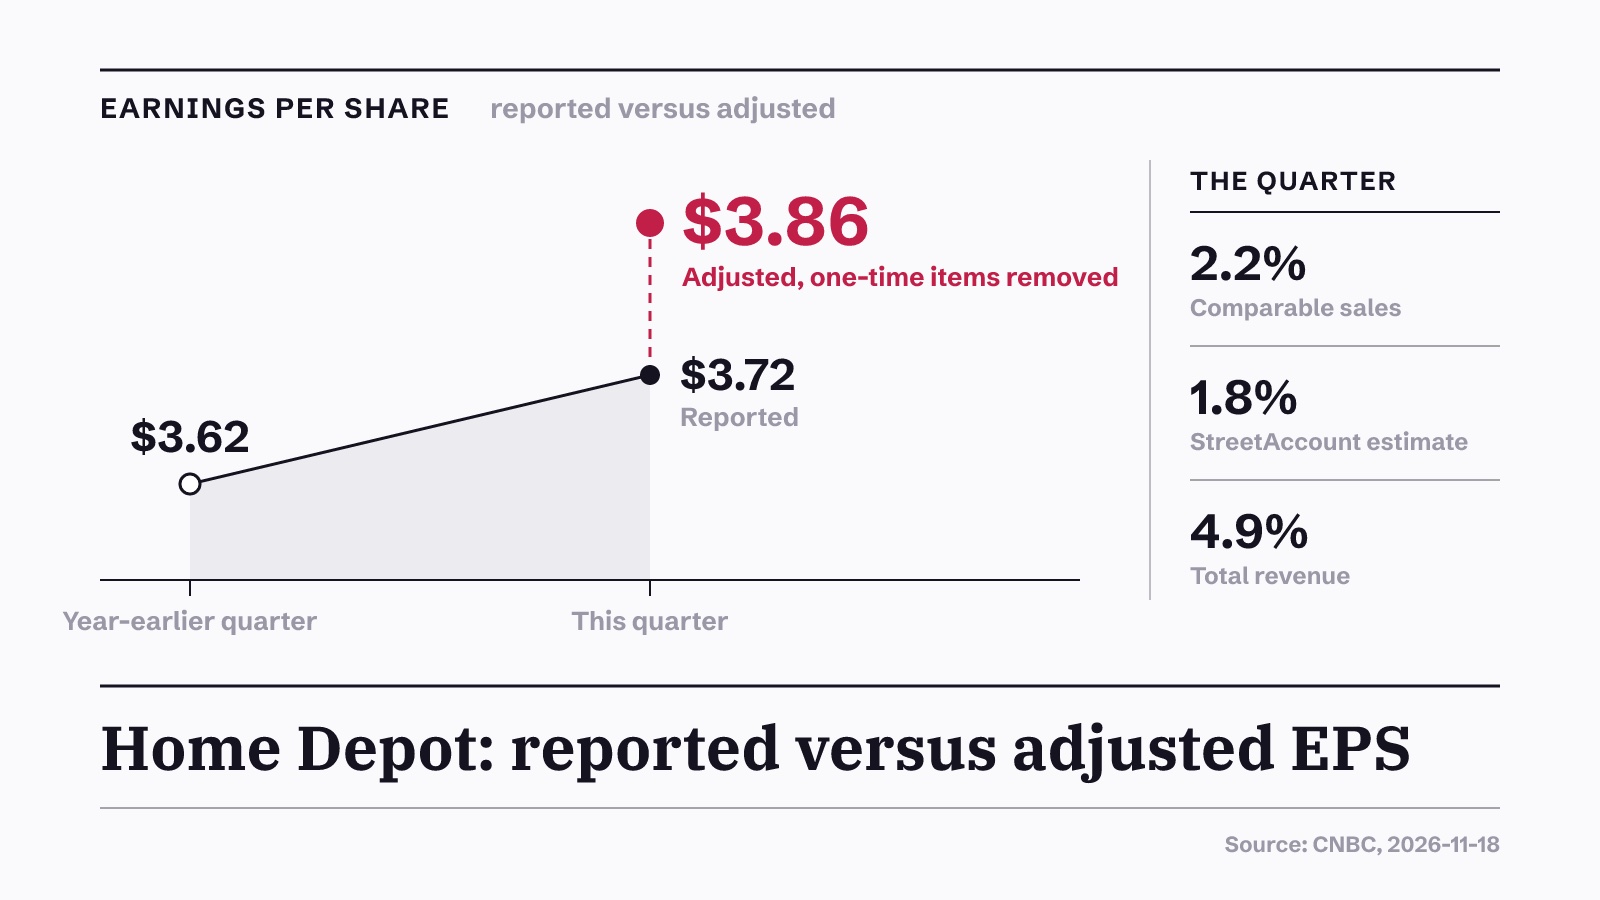
Home Depot reported fiscal third-quarter earnings and revenue above analyst expectations and, on the same day, named finance chief Richard McPhail as its next CEO, CNBC reported. The shares still fell more than 3%. This article looks at the three numbers the report turns on: comparable sales, reported versus adjusted earnings per share, and the updated full-year outlook.
The headline in plain words
Home Depot sells tools, building materials and home improvement supplies to homeowners and to professional customers such as contractors. According to CNBC, the company said on Tuesday that McPhail will replace Ted Decker as CEO, with the change taking effect next week. Decker has led the retailer since 2022. He had been on temporary medical leave from August, has now returned, and will stay on as chair of the board.
Two other roles changed as well. Ann-Marie Campbell, who runs U.S. stores and operations, becomes president and chief operating officer. Jordan Broggi takes over from McPhail as chief financial officer. McPhail has been at the company since 2005, so this is an internal handover.
The number behind it: comparable sales
For a retailer, the first figure many analysts check is comparable sales, often called comps or same-store sales. It measures sales growth at stores and channels that were already open a year ago. New stores are left out, so the number shows whether existing locations are selling more, not just whether the company got bigger.
Home Depot said comparable sales grew 2.2% in the quarter. StreetAccount's estimate was growth of 1.8%, so the result came in above what analysts expected. Total revenue rose 4.9% from a year earlier. When total revenue grows faster than comps, the difference comes from sources outside the comparable base, such as newer stores or businesses that were not part of last year's figure. Reading the two numbers side by side tells you how much of the growth came from the existing business.
The detail behind the comps matters too. Online comparable sales rose around 13%, the sixth straight quarter of double-digit growth on that measure. Of 16 merchandising departments, 13 posted positive comparable sales, and the power department grew by a double-digit percentage. A gain spread across most departments is usually read as broader than one driven by a single category.
Reported EPS versus adjusted EPS
Earnings per share, or EPS, is net income divided by the number of shares. Home Depot earned $3.71 billion in net income this quarter, which works out to $3.72 a share. A year earlier the same quarter brought in $3.60 billion, equal to $3.62 a share. That is the reported figure, calculated under standard accounting rules.
The company also gave an adjusted EPS of $3.86, which strips out one-time items. Reported EPS includes every cost the accounting rules count. Adjusted EPS is the company's own view of the underlying business, with some items removed. When you see a beat, check which version the estimate was compared against, and read the company's list of what it excluded. Analyst estimates are usually set against the adjusted figure, so the label matters.
Reading the narrowed outlook
Guidance is the company's forecast for the rest of its fiscal year. For total sales, Home Depot now forecasts growth of roughly 4.5%, which matches the highest point of the range it gave before. It sees comparable sales up around 1.4%, against a previous outlook of flat to a 2% increase. For adjusted EPS, it now expects growth of 2%, replacing a range of flat to a 4% increase.
When a company swaps a range for a single figure late in the year, it is narrowing its forecast because most of the year is already known. The useful question is where the new figure sits inside the old range. Here, the adjusted EPS figure sits in the middle of the earlier range rather than at its top, while the sales figure sits at the top. Readers often weigh a mixed outlook like this alongside the quarterly beat.
What the company said, and the risks it named
CNBC listed the pressures on the business: a slow housing market, elevated mortgage rates and more careful consumers. The company has pointed to steady spending by professional customers. McPhail told CNBC that the company is gaining market share even though it faces more challenges than early in the year, and that it will keep focusing on contractors and other pro shoppers and on AI tools to drive sales. "We're not going to change course," McPhail told CNBC. A leadership change, however orderly, adds a period in which investors watch whether the plan and the numbers stay on track.
How to check this yourself next time
You can run the same reading on any retailer's quarterly report in a few minutes.
- Find comparable sales first and set it next to total revenue growth; the gap shows how much growth came from outside existing stores.
- Look for both reported and adjusted EPS, then read the reconciliation table that lists the one-time items removed.
- Compare the new full-year guidance with the previous range and note whether each figure lands at the top, middle or bottom.
Sources
- CNBC, 17 Nov 2026
AI-drafted from the filings and reports above, then published automatically after checks that each number appears in a cited source and that no wording is copied. There was no human edit. Educational reading only, not a recommendation on any stock.