Explainer · Earnings & Analyst Ratings
How to read an earnings report
Every quarter, a public company tells investors how much it sold, what it kept and what it expects next. Here is how to read that report in order, using a real 10-K as the example.
Quick answer
Start with revenue, then net income and diluted earnings per share, each compared with the same period a year earlier. Then read the cash flow and management's outlook. Adjusted figures must be reconciled to GAAP numbers [11], so check both.
Key points
- Most companies announce results in a press release, and that release must also be filed with the SEC on Form 8-K [1].
- The full quarterly report is the 10-Q, and the annual report is the 10-K; both are free on the SEC's EDGAR database [3].
- Compare each number with the same period a year earlier, not only with analyst estimates.
- A company can beat estimates and still see its shares fall if its outlook disappoints [1].
- Adjusted (non-GAAP) earnings must come with the most directly comparable GAAP figure and a reconciliation between the two [11].
On this page
What is an earnings report?#
An earnings report is a company's announcement of how it performed over a finished quarter or year. In practice it arrives in two layers.
The first layer is the earnings release. FINRA notes that most companies issue a press release with basic information about financial performance, including sales and earnings, and that a company issuing one must file it with the SEC on Form 8-K [1]. The 8-K item for this is Item 2.02, Results of Operations and Financial Condition, which covers any announcement of material non-public information about results for a completed quarterly or annual period [2].
The second layer is the periodic report: the 10-Q for a quarter or the 10-K for a full year. The 10-Q contains unaudited quarterly financial statements and management's discussion of the quarter, while the 10-K contains audited annual statements, risk factors and management's discussion of the year [3]. Our guide to 10-K, 10-Q and 8-K filings explains each form in detail.
The table below shows where each piece of an earnings report lives and when it appears.
| Document | What it contains | When it appears |
|---|---|---|
| Earnings press release | Headline sales and earnings, often an outlook | When the company chooses |
| Form 8-K, Item 2.02 | The text of the release | Within four business days |
| Earnings call | Management comments, analyst questions, guidance | When the company chooses |
| Form 10-Q | Unaudited quarterly statements, MD&A, risk updates | 40 or 45 days after quarter end |
| Form 10-K | Audited annual statements, risk factors, MD&A | 60, 75 or 90 days after year end |
Sources: press release and call [1], 8-K timing and Item 2.02 [2], 10-Q and 10-K contents [3], 10-Q deadlines [4], 10-K deadlines [5]. Deadlines depend on the company's filer status.
When do companies report earnings?#
Results come out after a quarter closes, so the busy periods repeat every three months. FINRA says earnings season typically begins in the first two weeks after the end of each quarter, which means early to mid January, April, July and October for companies whose quarters follow the calendar [1].
The formal filing has a legal deadline. A 10-Q is due 40 days after the quarter ends for large accelerated and accelerated filers, and 45 days for all other companies [4]. There is no 10-Q for the fourth quarter; that quarter is covered by the annual 10-K [4]. Not every company's year ends in December. Microsoft's fiscal 2026, for example, ended on June 30, 2026 [6].
Which numbers should you read first?#
An earnings release can be long. Reading a few lines in a fixed order keeps you from being steered by whichever number the headline chooses. The SEC's guide to financial statements is the reference for what each line means: the income statement shows the revenue earned over a period and the expenses, and its bottom line is net earnings or loss [9].
- Revenue
The top line: what the company sold. The SEC's guide calls gross revenues or sales the top line, and net revenues what remains after returns and allowances [9]. Compare it with the same quarter a year earlier.
- Net income
The bottom line after all expenses, interest and taxes. A rising top line with a falling bottom line means costs grew faster than sales. Our page on reading an income statement walks through every line in between.
- Diluted earnings per share
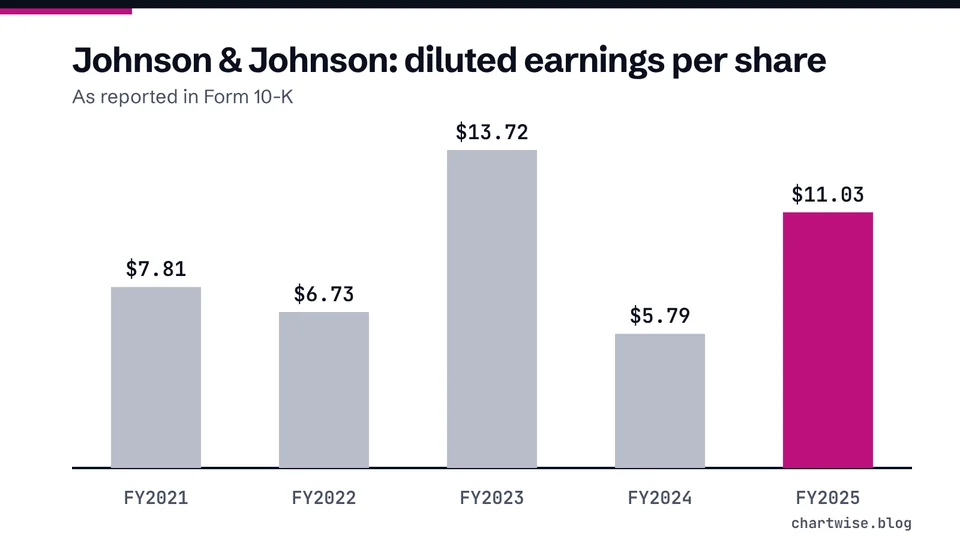
Net income divided by common shares, plus the shares that options, warrants and convertible securities could add [10]. See earnings per share explained.
- Cash flow
The cash flow statement reports cash in and out in three parts: operating, investing and financing activities [9]. Profit and cash can move in different directions in the same period.
Here is the first part of that routine applied to a real filing. The figures are Microsoft's, as reported in its Form 10-K for the fiscal year ended June 30, 2026 [6], compared with fiscal 2025. We read them from the SEC's structured data for that filing. The full history is on our Microsoft filings page.
- Revenue
- $331.84 billionForm 10-K; up from $281.72 billion, +17.79%, change calculated
- Net income
- $133.75 billionForm 10-K; up from $101.83 billion, +31.34%, change calculated
- Diluted EPS
- $17.95Form 10-K; up from $13.64, +31.6%, change calculated
- Diluted shares
- 7.453 billionForm 10-K weighted average; down from 7.465 billion, -0.16%, change calculated
Reading the three together tells you more than any one of them. Net income grew faster than revenue, and diluted EPS grew slightly faster than net income because the diluted share count fell a little (calculated). That is the kind of pattern worth noting before you read anyone's opinion of the results.
What does it mean when a company beats or misses estimates?#
Before results come out, Wall Street analysts publish their own estimates of revenue and earnings. FINRA explains that several groups track a consensus estimate, which is the average for all the analysts covering the stock, and that a company beats or misses depending on how its actual numbers compare [1]. Our guide to analyst ratings and price targets covers who these analysts are and why their views can be conflicted.
FINRA also says a company's shares might jump or tumble after investors compare results with estimates [1]. In other words, the reaction depends on what investors expected, not only on what the company did. A company can grow strongly and still fall short of what the market expected, or shrink and still beat a gloomy forecast. This is why it helps to compare results with the company's own past first, and with estimates second.
What is the difference between GAAP and adjusted earnings?#
Some releases show two sets of earnings. GAAP figures follow generally accepted accounting principles. Adjusted figures, also called non-GAAP measures, are other versions of the numbers that the company chooses to calculate and present.
SEC Regulation G sets the ground rules. When a company publicly discloses a non-GAAP measure, it must also present the most directly comparable GAAP measure and a reconciliation between the two, which must be quantitative for historical figures [11]. A non-GAAP measure may not be presented in a way that is misleading [11].
In the hypothetical example above, suppose the $1.56 was adjusted EPS and GAAP EPS was $1.20. The reconciliation would have to explain the $0.36 gap (calculated). Adjusted EPS is 30% higher than GAAP EPS in this case (calculated). Read the reconciliation and ask whether the excluded costs are really one-off, or whether they show up every year.
What happens on the earnings call?#
FINRA says many companies hold earnings conference calls for analysts and investors, where management may add detail on the quarter, take questions from analysts and provide guidance [1].
You do not need to be a professional to hear the same information. Under Regulation FD, when a company discloses material nonpublic information to covered people such as brokers, investment advisers, or shareholders likely to trade on it, it must make that information public, at the same time if the disclosure is intentional [12]. Public disclosure can be a Form 8-K or another method reasonably designed to reach the public broadly [12]. To see what a company has made public, check its investor relations page and its recent 8-K filings on EDGAR [3].
Mistakes beginners make with earnings reports#
- Reading only the headline
The headline number is the one the company chose to lead with, sometimes an adjusted figure. Check revenue, GAAP net income and diluted EPS in the statements themselves.
- Ignoring the comparison period
A quarter is easier to judge next to the same quarter a year earlier. If a business is seasonal, comparing with the previous quarter can mislead.
- Treating a beat as good news by default
Shares can fall after a beat when the outlook disappoints [1]. Read the outlook section before deciding what the results mean.
- Trading on the first price move
Earnings days can be volatile. FINRA notes that long-term investors often dismiss this volatility as temporary and focus on their core analysis [1].
- Skipping the filing
The press release is a summary. The 10-Q or 10-K has the full statements, risk updates and footnotes, free on EDGAR [3].
Frequently asked questions#
Where can I find a company's earnings report?
On the company's investor relations website, and on the SEC's free EDGAR database, where you can search by company name or ticker [3]. The press release is attached to a Form 8-K, and the full results are in the 10-Q or 10-K.
Is the quarterly report audited?
No. The 10-Q contains unaudited quarterly financial statements, while the annual 10-K contains audited statements [3].
What is the difference between basic and diluted EPS?
Basic EPS divides net income by outstanding common shares. Diluted EPS adds the shares that could be created if options, warrants or convertible securities were exercised [10].
Does a strong earnings report mean the stock will go up?
No. Shares might jump or tumble after investors compare results with estimates, and a company can beat estimates and still fall on a weak outlook [1]. Past results do not tell you what the price will do next.
The bottom line#
Read an earnings report in the same order every time: revenue, net income, diluted EPS, cash flow, then the outlook, each compared with a year earlier. Treat the consensus estimate as one reference point, not a verdict, and check every adjusted figure against its GAAP reconciliation. Use the free filings on EDGAR rather than headlines, and remember that no report tells you where a share price will go next. Try your own year-over-year comparisons with the percent change calculator.
Sources
- What Is Earnings Season?.
- Form 8-K General Instructions (SEC 873 (02-25)).
- Using EDGAR to Research Investments.
- Form 10-Q General Instructions (SEC 1296 (02-25)).
- Form 10-K (SEC 1673 (02-25)).
- Microsoft Corporation Form 10-K for the fiscal year ended June 30, 2026.
- SEC Proposes Amendments to Permit Optional Semiannual Reporting for Public Companies.
- Semiannual Reporting (File No. S7-2026-15).
- Beginners' Guide to Financial Statements.
- Financial Performance Metrics Every Investor Should Know.
- 17 CFR 244.100 General requirements.
- 17 CFR Part 243 Regulation FD.
Education only. This page is not investment, tax or legal advice. Stocks can lose value. See our risk disclosure.