News analysis ·
Meta beats on revenue: reading free cash flow and capex
Meta beat revenue forecasts but its stock fell as free cash flow turned negative. How to find free cash flow and capex in a report.
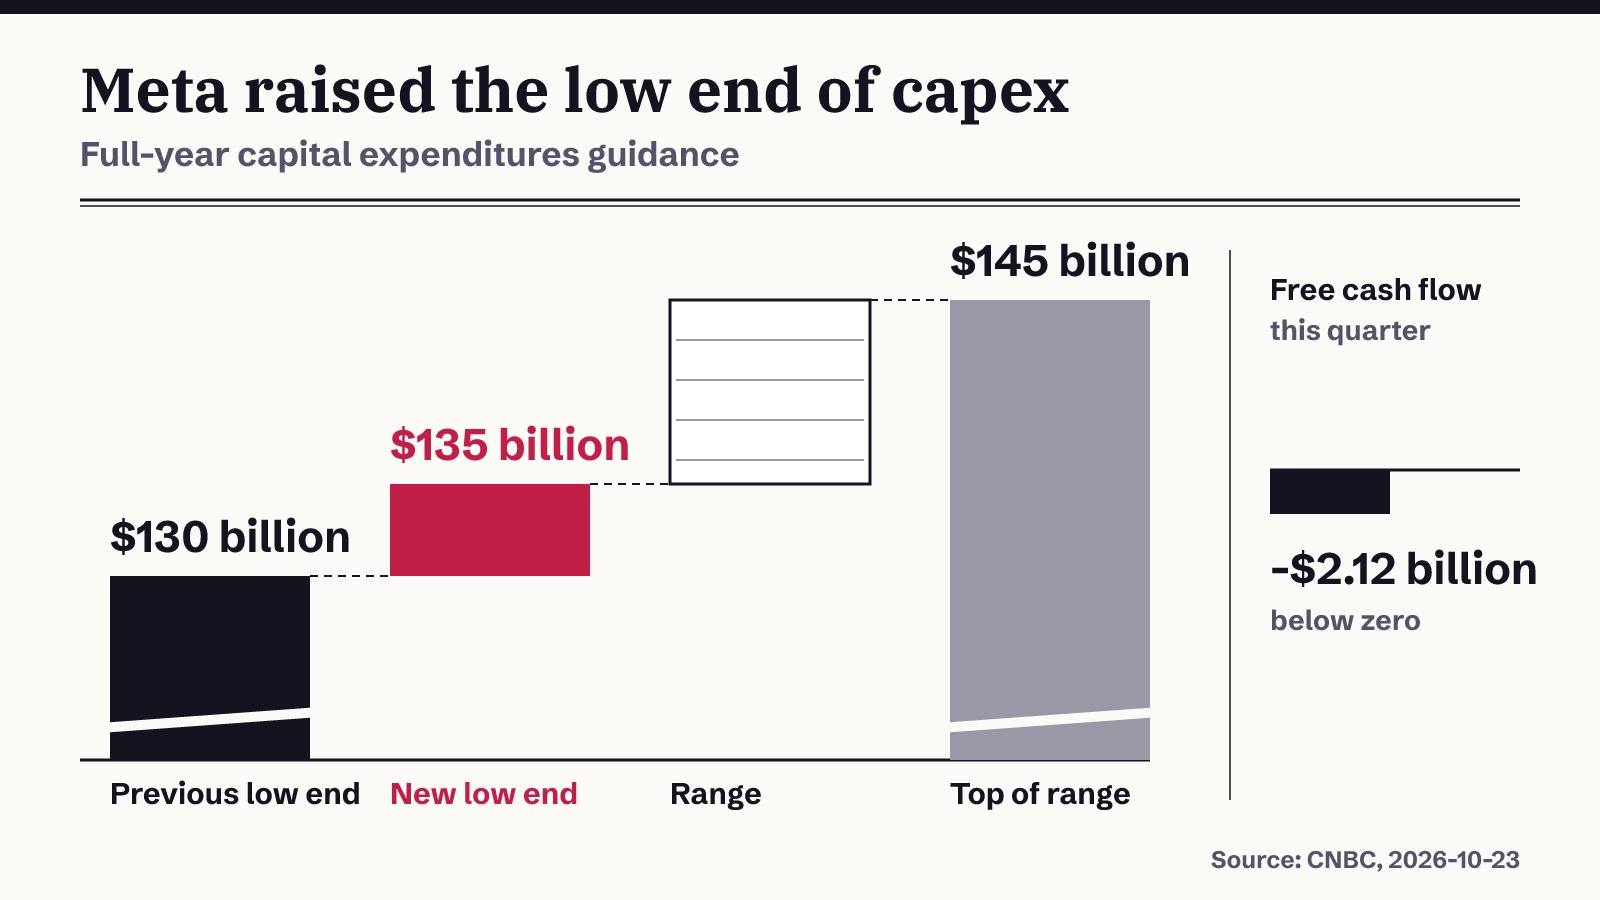
Meta reported third-quarter revenue above what analysts expected, yet its stock fell nearly 7% on Thursday, according to CNBC. One number to look at is not sales but cash: free cash flow came in below zero as spending on artificial intelligence climbed. This article looks at where that figure sits in a report, how it relates to capital spending, and why a revenue beat does not settle the story.
A revenue beat with a cash problem
On the top line, the quarter looked strong. CNBC reported revenue of $64.60 billion, up 26% from a year earlier and above the $63.37 billion analysts had forecast.
The cash line told a different story. Free cash flow for the quarter was a negative $2.12 billion, and CNBC linked that result to heavy AI spending. Meta also lifted the bottom of its full-year spending plan. Shares dropped nearly 7% on Thursday.
For a new reader, the lesson is simple. Revenue is what a company sells. It says nothing about how much cash is left after the company pays for its growth.
The number behind it: free cash flow
Free cash flow is the cash a business generates from its operations, minus the money it spends on long-lived assets such as data centers, servers and buildings. That second part is called capital expenditures, or capex.
You will not usually find free cash flow as a line on the official cash flow statement. Companies often show it in a separate table, and readers can also work it out from two lines in that statement: cash from operating activities and purchases of property and equipment.
When free cash flow is negative, the company is spending more on investment than its operations bring in during that period. That gap has to be covered from cash on hand, from borrowing or from selling new shares. A negative figure is not automatically a sign of trouble. A business in a heavy building phase can show it for a while. But it shifts the question from how fast sales grow to how the spending gets paid for.
Reading the capex guidance
Guidance is the range a company gives for a future figure. Meta now expects full-year capital expenditures of $135 billion to $145 billion, CNBC reported. The bottom of that range was previously $130 billion.
When only the low end of a range moves up, the company is telling you the minimum it plans to spend has risen. For free cash flow, capex is the part that gets subtracted. So a higher capex floor means more cash going out, unless operating cash flow rises with it.
This is why investors read capex guidance next to revenue. Sales growth that requires ever larger spending can still leave less free cash at the end.
Other signals in the report
Earnings per share, or EPS, is net profit divided by the number of shares. Meta reported EPS of $3.83. CNBC noted it was unclear whether that figure lined up directly with the $5.75 Wall Street had expected. This is a useful reminder: before calling a result a beat or a miss, check that the company and the analysts measured the same thing.
There was a credit signal too. A credit default swap is a contract that pays out if a borrower fails to pay its debt, and its spread is the cost of that protection. CNBC said spreads on Meta five-year contracts reached record highs on Thursday, which it read as growing investor concern about credit.
Meta also used its Wednesday earnings release to announce a new Class C common stock with no voting rights. The company said the structure keeps it founder-led and gives it a way to finance growth. An SEC filing said CEO Mark Zuckerberg might leave California if a proposed state wealth tax passed, and that the new stock plan persuaded him to stay. Issuing new shares can dilute existing holders, so a share class tied to funding is worth reading alongside the cash figures.
How to check this yourself next time
You can repeat this reading with any company that reports quarterly results.
- Open the cash flow statement and find cash from operating activities and capital expenditures, then see whether the company also publishes its own free cash flow figure.
- Look for capex guidance in the release or call, and note whether the whole range moved or only one end.
- Compare revenue growth with the change in free cash flow, and check whether the EPS figure is measured the same way as the analyst estimate.
As CNBC put it, "Free cash flow came in at a negative $2.12 billion during the quarter." That line shows why a revenue beat does not tell the whole story. CNBC did not give a single reason for the share move, and no one figure explains a price on its own. Share prices can fall as well as rise, and anyone who invests can lose money, so treat this as a way to read a report, not a signal to act.
Sources
- CNBC, 22 Oct 2026
AI-drafted from the filings and reports above, then published automatically after checks that each number appears in a cited source and that no wording is copied. There was no human edit. Educational reading only, not a recommendation on any stock.