News analysis ·
Walmart's Profit Dip and Beat: Reading Adjusted EPS
Walmart's reported profit fell while adjusted EPS edged past forecasts and guidance rose. Here is how to read the two EPS figures and the new ranges.
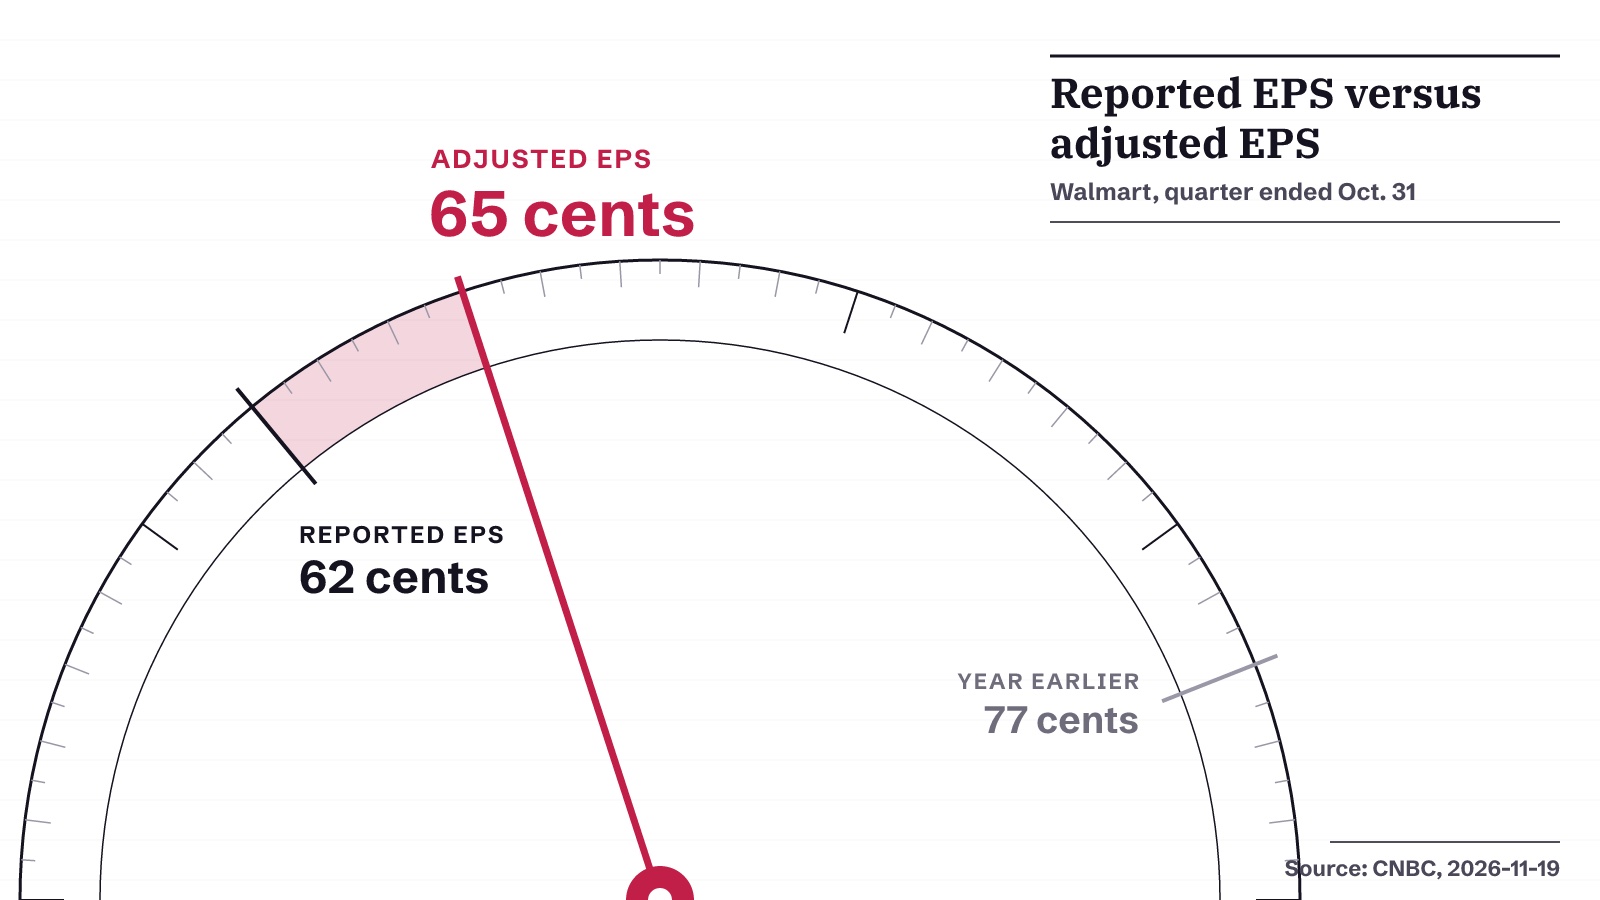
Walmart's fiscal third-quarter results came in slightly ahead of analyst forecasts, and the retailer raised its full-year outlook, CNBC reported. Yet the profit line itself was lower than a year earlier. This article explains how both things can be true at once, and how to read reported EPS, adjusted EPS and a guidance range side by side.
The headline in plain words
Walmart sold more, beat expectations on its preferred profit measure, and told investors it now expects a slightly better year than it said before. At the same time, the net income it reported under standard accounting rules fell.
For the quarter that ended Oct. 31, CNBC reported that Walmart's profit was $4.95 billion, or 62 cents a share. A year before, the same line showed $6.14 billion, or 77 cents a share. Revenue for the whole company grew 5.2%.
So a beginner might see two different earnings numbers on the same day. That is the gap between reported and adjusted figures.
The number behind it: reported EPS versus adjusted EPS
Earnings per share, or EPS, is profit divided by the number of shares. It tells you how much profit belongs to each share. Reported EPS follows standard accounting rules, often called GAAP. It includes everything, even items that have little to do with selling goods in the quarter.
Adjusted EPS removes some of those items. CNBC reported that Walmart's adjusted figure was 65 cents per share after stripping out investment gains and losses, tax items and reorganization charges. Investment gains and losses can swing reported profit without any change in how the stores performed.
This is why a company can show lower reported profit and still beat forecasts. Analyst estimates are usually built on the adjusted number. When a headline says a company topped estimates, it is often comparing adjusted EPS with the analyst average.
The adjusted figure is a company choice, though. Management decides which items to leave out. A careful reader looks at both numbers and asks what sits in the gap. Here, the adjusted figure leaves out investment gains and losses, tax items and reorganization charges, so those are the places to look in the gap.
What Walmart and CNBC said about the quarter
The sales lines were solid. Walmart U.S. net sales reached $125 billion, a 3.6% rise on the prior-year quarter. Comparable sales excluding fuel rose 2.9%, which matched expectations, according to StreetAccount data cited by CNBC. Comparable sales cover stores open at least a year.
Sam's Club net sales came to $25.9 billion, a 10% gain, helped by grocery and general merchandise. Global e-commerce sales rose 17%. Walmart U.S. online sales grew 23%, Sam's Club U.S. online sales grew 30%, and the Walmart U.S. advertising business posted a 37% sales gain. Global membership fee revenue increased 17%.
CFO John David Rainey told CNBC, "This was another really solid quarter for us, we feel good about it". He also said Walmart had its biggest food market share gains in three years. CEO John Furner said diesel costs ran higher than expected, while tariff refunds helped offset them, and that Walmart cut prices on nearly 8,000 products.
Higher fuel and transport costs are a risk worth noting. They feed into what the company pays to move goods, and they can squeeze margins if they stay high.
Reading the new guidance ranges
Guidance is the company's own forecast for the full year. Walmart gave it as ranges, and each one moved up. Net sales growth is now expected at 4.9% to 5.2%, compared with 4% to 5% before. Adjusted EPS guidance is now $2.84 to $2.89, versus $2.80 to $2.87. Adjusted operating income is now seen rising 8% to 8.6%, up from 7% to 8.5%.
Look at both ends of each range. In every case the low end rose, and the ranges got narrower. A higher floor tells you management is more confident about the worst case. A narrower range means less uncertainty with fewer months left in the year.
Notice too that the EPS guidance is adjusted. It is built on the same basis as the 65 cents, not the 62 cents. Rainey said the company keeps flexibility in its guidance and that the fourth quarter has begun well. That is a company statement, not a promise, and a forecast can turn out wrong.
How to check this yourself next time
When a company says it beat estimates while its profit fell, a short routine helps you see what happened.
- Find both EPS figures in the earnings release: the reported, or GAAP, number and the adjusted one, and note which one analysts were forecasting.
- Read the reconciliation table that lists each adjustment, and ask whether those items are one-time or keep coming back every quarter.
- Compare the new guidance range with the old one, checking whether the low end, the high end or both moved, and whether it is stated on an adjusted basis.
Sources
- CNBC, 19 Nov 2026
AI-drafted from the filings and reports above, then published automatically after checks that each number appears in a cited source and that no wording is copied. There was no human edit. Educational reading only, not a recommendation on any stock.