Explainer · Stock Charts
Technical indicators and "Strong Buy" summaries, explained
Many stock pages show a dial or a label that reads "Strong Buy" or "Sell". It looks like advice. It is a tally of chart formulas, and it can flip in minutes.
Quick answer
A technical summary is a vote count. Formulas such as moving averages and the RSI each say buy, sell or neutral. TradingView, which publishes its method, averages the votes into a label from Strong Sell to Strong Buy [4]. It describes recent prices, not an analyst rating or a forecast.
Key points
- Investing.com says its summary is derived from simple and exponential moving averages plus key technical indicators for a chosen time interval [2].
- In TradingView's published method, an overall score above 0.5 is labelled Strong Buy [4].
- The same stock can be Buy on a daily chart and Sell on a 15-minute chart, because each time frame is counted separately.
- Analyst ratings in FINRA-regulated research must define each rating and its time horizon [8]; a technical summary is a formula output.
- Past performance cannot predict how a strategy will perform in the future [11].
On this page
What is a technical analysis summary?#
Technical analysis works from price history. The CFTC's glossary describes charting as the use of graphs and charts in technical analysis to plot trends of price movements, average movements of price and volume of trading, and a chartist as a technical trader who reacts to signals derived from graphs of price movements [1]. A technical summary takes many chart formulas, runs them on recent prices, and reduces the results to one word.
Investing.com describes its summary as derived from simple and exponential moving averages along with key technical indicators, shown for specific time intervals [2]. On investing.com's technical page for a stock, a summary is shown for time frames from 1 minute to monthly, next to a "Moving Averages" block and a "Technical Indicators" block that count Buy and Sell votes [3].
The label is the last step of a long chain. To read it, you need to know what is being counted.
How is a "Strong Buy" rating calculated?#
Investing.com names its inputs but does not publish the exact formula or thresholds on its summary page [2]. TradingView, another charting site, does publish its method, and it is a clear example of how these summaries work [4]:
- Each indicator votes
Every moving average and every oscillator scores +1 for buy, 0 for neutral or -1 for sell [4].
- Average each group
The moving average rating is the mean of 15 moving-average votes; the oscillator rating is the mean of 11 oscillator votes [4].
- Average the two groups
The overall rating is the mean of the moving average rating and the oscillator rating [4].
- Map the score to a label
The score runs from -1 to +1 and is cut into five bands, shown in the table below [4].
TradingView's bands for the overall score:
| Label | Score range |
|---|---|
| Strong Buy | Above 0.5 |
| Buy | Above 0.1, up to 0.5 |
| Neutral | -0.1 to 0.1 |
| Sell | Below -0.1, down to -0.5 |
| Strong Sell | Below -0.5 |
Thresholds from TradingView's Technical Ratings documentation [4]. Other sites may use different rules.
What does the moving averages vote mean?#
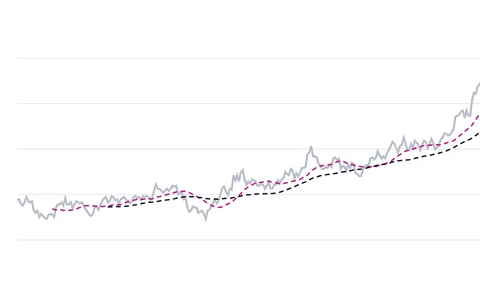
A moving average is the average of prices over a period as short as a few days or as long as several years [5]. In TradingView's method, a simple moving average votes Buy when its value is below the current price and Sell when it is above [4].
That rule has a consequence worth seeing clearly: when price is above every average, every average votes Buy at the same moment. Investing.com's page lists averages from MA5 to MA200, each in a simple and an exponential version [3]. Twelve Buy votes can therefore come from one fact, that the price is above its recent averages, counted twelve times.
What do oscillators like RSI and MACD measure?#
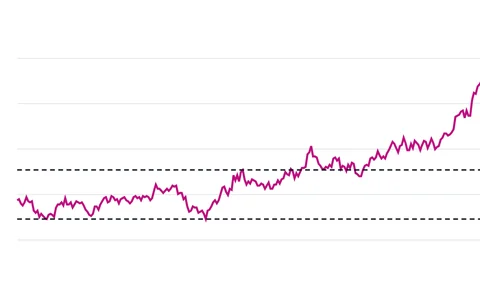
Oscillators are indicators that try to show the strength of a trend and whether a market is over-bought or over-sold [6]. Investing.com's indicator block includes names such as RSI(14), STOCH(9,6), MACD(12,26), Williams %R and CCI(14) [3]. The common readings for three of them:
| Indicator | What it tries to show | Common reading |
|---|---|---|
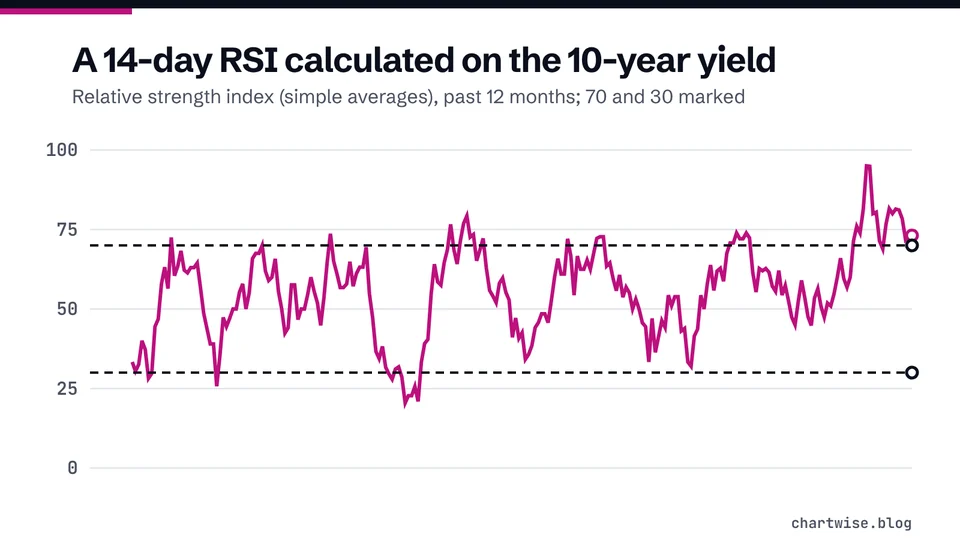
| RSI (relative strength index) | Whether a market is over-bought or over-sold | Over 70 over-bought, 30 over-sold |
| Stochastics | Same idea as RSI, with different cut-offs | Over 80 over-bought, below 20 over-sold |
| MACD | Direction of the momentum of the trend | A divergence from price might signal a change |
Readings as described by CME Group [6]. They are conventions, not rules.
Why can the same stock show Buy and Sell at once?#
Because each time frame is counted separately. A 15-minute chart is built from 15-minute bars, so even a 200-bar average spans only 50 hours of trading (calculated); a daily chart is built from daily bars, so its averages cover days to months. CME Group notes that longer-term traders may watch weekly or monthly charts while shorter-term traders use 60-minute or 5-minute charts [7]. The summary simply reflects which window you picked.
- Daily, moving average rating
- 0.6(12 - 3) / 15, calculated
- Oscillator rating
- 0.18(4 - 2) / 11 = 0.1818, calculated
- Daily, overall score
- 0.39mean of 0.6 and 0.1818, calculated; label Buy
- 15-minute, overall score
- -0.21mean of -0.6 and 0.1818, calculated; label Sell
Is a "Strong Buy" summary the same as an analyst rating?#
No. When a FINRA member firm publishes a research report with ratings, FINRA Rule 2241 requires it to define the meaning of each rating, including the time horizon and any benchmarks, and to show what percentage of the stocks it covers it rates buy, hold or sell [8]. Read more in analyst ratings and price targets.
A technical summary is an automatic formula output. TradingView states its ratings are general market information for educational and entertainment purposes only and do not constitute investment advice [4]. Investing.com's risk disclosure says prices on its pages are indicative and not appropriate for trading purposes [2].
Do technical indicators predict prices?#
The evidence is mixed and modest. A study of U.S. stocks from 1962 to 1996 found that several technical indicators provide incremental information and may have some practical value, and also called technical analysis highly subjective [9]. A New York Fed test on 1996-1998 currency data found exchange rates bounced off published support and resistance levels 60.8% of the time versus 56.2% for arbitrary levels [10]; see support and resistance.
Neither finding says a summary label makes money after costs. The SEC warns that past performance cannot predict future performance and that back-tested results are hypothetical [11]. Its 2005 guide on day trading says day traders typically suffer severe financial losses in their first months, and many never become profitable [12].
Mistakes beginners make with technical summaries#
- Reading the label as advice
"Strong Buy" on a technical page is a vote count, not a recommendation from anyone [4].
- Not checking the time frame
A 5-minute Strong Buy and a monthly Strong Buy describe completely different price histories.
- Counting the same signal many times
Twelve moving averages above price can all reflect one recent rise. More votes are not more evidence.
- Trading the over-bought reading
An RSI above 70 can stay there for a long time in a strong trend [6].
- Ignoring the company
Technical analysis works from price movements [1]. It says nothing about earnings, debt or the business, which you can read on a stock quote page.
Frequently asked questions#
What does "Strong Buy" mean on investing.com's technical page?
It is the summary of moving averages and technical indicators for the time frame you selected [2]. The site does not publish the exact thresholds on that page, so treat it as a tally of chart formulas, not a recommendation.
Why did the summary change since this morning?
Summaries may be recalculated as new prices arrive. Short time frames such as 5 or 15 minutes cover only recent hours or days of bars, so a small move can change many votes.
Is a technical summary the same as an analyst's Buy rating?
Which indicator is the most reliable?
The sources we cite do not rank indicators. CME Group describes common readings for RSI, stochastics and MACD and warns that signals can persist long before a reversal [6].
The bottom line#
A technical summary compresses many chart formulas into one word. Check the time frame, remember that many votes can repeat one fact, and keep it separate from analyst research and from what the company itself reports. Learn the building blocks in how to read a stock chart, and read our risk disclosure before trading on any signal.
Sources
- CFTC Glossary.
- Technical Summary - Investing.com.
- Apple Inc (AAPL) Technical Analysis - Investing.com.
- Technical Ratings.
- Moving average.
- Oscillators: MACD, RSI, Stochastics.
- Chart Types: candlestick, line, bar.
- 2241. Research Analysts and Research Reports.
- Foundations of Technical Analysis: Computational Algorithms, Statistical Inference, and Empirical Implementation.
- Support for Resistance: Technical Analysis and Intraday Exchange Rates.
- Investor Bulletin: Performance Claims.
- Day Trading: Your Dollars at Risk.
Education only. This page is not investment, tax or legal advice. Stocks can lose value. See our risk disclosure.