Explainer · Reading a Stock Page
How to read a stock quote, line by line
A stock quote packs a dozen numbers into one small box. Each one answers a different question, and none of them tells you whether to buy.
Quick answer
Start with the last price and the change from the previous close. Then check bid and ask, the day's range and volume to see how the stock is trading today. Market cap, P/E and yield describe the company, not today's trading [10] [5].
Key points
- The headline price is the last trade, and a delayed quote can lag 15 or sometimes 20 minutes [2].
- On most quote pages the change line compares that price with the previous session's close, so a big percentage can come from a small dollar move.
- Bid is the most a buyer will pay right now and ask is the least a seller will take; the gap is the spread [5].
- Volume counts shares traded once per trade, not once per side [8].
- Market cap, P/E and dividend yield are snapshots of the company. They are not ratings and they are not signals.
On this page
What is a stock quote?#
A stock quote is the summary box at the top of a stock page on sites like Yahoo Finance, Google Finance or investing.com. It shows the company name and ticker symbol, the latest price, how far that price has moved today and a set of statistics underneath.
The layout changes from site to site, but the lines are almost always the same. Some describe today's trading (last price, change, bid, ask, day's range, volume). Others describe the company (market cap, P/E, dividend yield). Keeping those two groups apart is most of the skill.
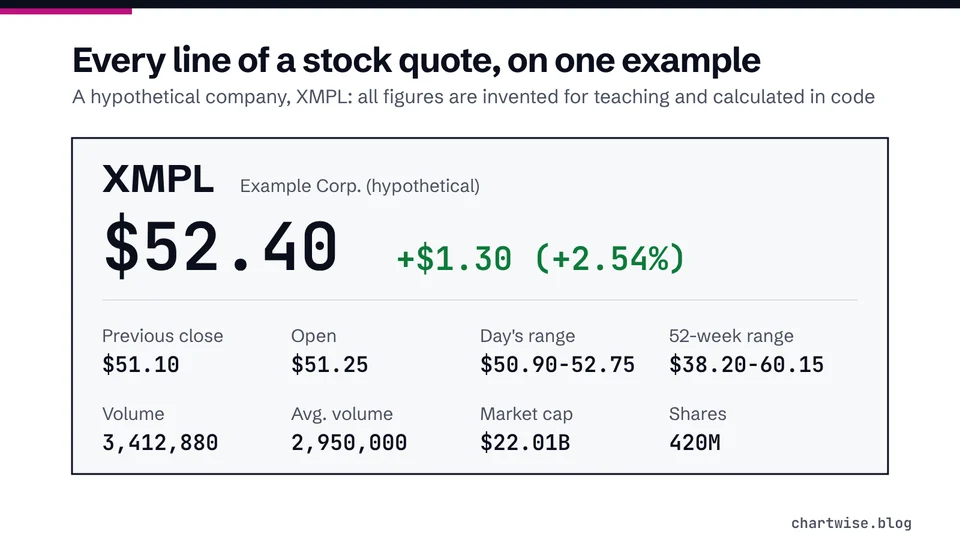
Below we use a hypothetical company with the ticker XMPL. All of its numbers are invented for teaching and were calculated in code.
What do the price and change lines tell you?#
The large number is the last price: the price of the most recent trade the site received. A real-time quote shows the most recent bid and offer, while a delayed quote shows the same information 15 and sometimes 20 minutes after the fact [2]. Free pages often label the delay in small print near the price, so look for it before you react to a move.
Next to it is the change, in dollars and in percent. On most quote pages it is measured from the previous session's closing price. For XMPL, a last price of $52.40 against a previous close of $51.10 is a change of +$1.30, or +2.54% (calculated). You can check any pair of prices with our percentage change calculator.
Regular trading hours run 9:30 a.m. to 4:00 p.m. Eastern Time [3], the same window as the NYSE core session [4]. Outside those hours, some pages add a separate pre-market or after-hours price. The SEC warns that extended-hours prices may not match prices at the close or at the next day's open [3]. Our page on pre-market and after-hours trading covers this in detail.
- Last price
- $52.40example
- Previous close
- $51.10example
- Change
- +$1.30 (+2.54%)calculated
- Market cap
- $22.01 billion420 million shares x $52.40, calculated
What do bid, ask and spread mean?#
The bid is the highest price a buyer is offering for a set number of shares at that moment. The ask (also called the offer) is the lowest price a seller will accept. The bid is almost always lower than the ask, and the difference between them is the spread [5].
Many pages show size next to each price, for example "52.39 x 300". That reads as a bid of $52.39 for 300 shares. For XMPL the ask is $52.41, so the spread is $0.02, about 0.038% of the $52.40 price (calculated).
FINRA notes that a narrow spread can indicate good liquidity but does not give a complete picture on its own, that illiquid investments often have a wide bid-ask spread, and that large spreads can reduce returns by raising the price you pay or lowering the price you get [6]. We go deeper in the bid-ask spread on a stock page.
How do you read open, day's range and 52-week range?#
Open is the first price of the regular session. On Nasdaq, an Opening Cross starts at 9:30 a.m. ET and sets the Nasdaq Official Opening Price; a Closing Cross at 4:00 p.m. sets the Nasdaq Official Closing Price [7].
Day's range is the lowest and highest trade so far today. 52-week range is the lowest and highest price over roughly the past year. Neither range predicts where the price goes next. They only show where it has already been.
The XMPL figures below show how to turn the ranges into plain sentences. The table reads each line of the hypothetical quote in order.
| Quote line | XMPL value | What it tells you |
|---|---|---|
| Open | $51.25 | First regular-session price, $0.15 (+0.29%) above the previous close (calculated) |
| Day's range | $50.90 to $52.75 | Lowest and highest trades so far today |
| 52-week range | $38.20 to $60.15 | Price is 64.7% of the way from the low to the high (calculated) |
| Distance from 52-week high | -12.88% | How far the last price sits below the year's high (calculated) |
| Volume | 3,412,880 | Shares traded so far today |
| Average volume | 2,950,000 | Typical shares per day over the site's look-back period |
All XMPL figures are hypothetical and were calculated in code.
What do volume and average volume show?#
Volume is the number of shares that changed hands. Nasdaq's definition makes one point beginners often miss: every trade has a buyer and a seller, so if A sells 100 shares to B, volume is 100 shares, not 200 [8]. Trades away from the main exchanges are reported too: trades in listed stocks on alternative trading systems, including dark pools, go to FINRA and are published on the consolidated tape [9].
Average volume is a typical day's volume over a look-back period that each site chooses. XMPL's 3,412,880 shares against a 2,950,000 average is about 1.16 times a normal day (calculated). FINRA notes that securities with higher trading volume are generally more liquid [6]. See volume and average volume for how to read those numbers.
What do market cap, P/E and dividend yield describe?#
These lines describe the company rather than today's trading.
Market cap is the share price multiplied by the number of shares outstanding [10]. XMPL's 420 million shares at $52.40 give a market cap of $22.01 billion (calculated). Our market cap explainer covers what that number does and does not mean.
P/E divides the current price by earnings per share, and Investor.gov's definition uses earnings for the past 12 months [11]. Earnings per share is net profit divided by the number of common shares [12]. With trailing EPS of $2.75, XMPL's P/E is 19.05 (calculated). More in our P/E ratio explainer.
Dividend yield divides the year's dividend by the stock's market price [13]. A dividend is a portion of profit paid to shareholders, usually on a fixed schedule, though a company can pay one at any time [14]. XMPL's $0.26 quarterly dividend is $1.04 a year, a 1.98% yield at $52.40 (calculated). A yield is not a promise of future payments; read dividend yield explained for why.
- Check the time stamp
Find the delay label or market-status note before reading any price. A 15-minute-old price can differ from the live market [2].
- Read the move
Compare last price with previous close, in dollars and percent. Ask whether the dollar move is large or only the percentage.
- Check trading conditions
Look at the spread and at volume against average volume. Large spreads can raise the price you pay or lower the price you get, and a large order in a low-volume stock can be hard to fill quickly [6].
- Place it in context
Use the day's and 52-week ranges to see where the price sits, without treating either end as a target.
- Read the company stats last
Market cap, P/E and yield are starting points for research, not verdicts. Open the company's filings for the full picture.
Mistakes beginners make with stock quotes#
- Reading the percentage without the dollars
A +10% move on a $2 stock is 20 cents (calculated). Always look at both figures.
- Ignoring the spread
Buying at the ask and selling at the bid costs money each time, and wide spreads cost more [6].
- Treating the 52-week low as a floor
A range only records past prices. Large company stocks as a group have lost money in about one year out of three on average [1].
- Mixing up market cap and share price
A $500 share can belong to a smaller company than a $20 share. Size depends on price times shares outstanding [10].
Frequently asked questions#
Is the price on a free stock page live?
Not always. Real-time quotes show the most recent bid and offer, while delayed quotes can lag 15 and sometimes 20 minutes [2]. Look for the delay label next to the price.
Why does the change say +2% when the stock barely moved?
The percentage is relative to the previous close. A small dollar move on a low-priced stock is a large percentage. In the XMPL example, $1.30 on a $51.10 close is +2.54% (calculated).
What does 52.39 x 300 mean next to the bid?
It usually means someone is bidding $52.39 for 300 shares. The bid is the highest price a buyer will pay for a specified number of shares at that moment [5].
Why is there a price after 4:00 p.m.?
Some pages show extended-hours trades. Those prices may not reflect regular-session prices at the close or the next open [3].
The bottom line#
Read a quote in two halves. The top half (last price, change, bid, ask, ranges, volume) tells you how the stock is trading now and what it costs to trade. The bottom half (market cap, P/E, yield) is a snapshot of the company that needs the filings behind it. None of the lines is a signal to buy or sell, and every stock can lose value. Next, read market cap explained or go back to the reading a stock page hub.
Sources
- Stocks - FAQs.
- Real time Definition.
- Extended-Hours Trading: Investor Bulletin.
- Holidays & Trading Hours.
- Bid Price.
- Understanding Market Liquidity and Your Investments.
- The Nasdaq Opening and Closing Crosses (FAQ).
- Trading volume Definition.
- Where Do Stocks Trade?.
- Market Capitalization.
- Price-earnings (P/E) Ratio.
- Earnings Per Share.
- Evaluating Performance.
- Dividend.
- Understanding Order Types | Investor.gov.
Education only. This page is not investment, tax or legal advice. Stocks can lose value. See our risk disclosure.