Explainer · Stock Charts
Moving averages explained: 50-day and 200-day
A moving average turns a jumpy price line into a smooth one by averaging recent closes. It is simple arithmetic, which is exactly why it always runs behind the price.
Quick answer
A moving average is the average of a stock's recent prices, recalculated each period: the newest price is added and the oldest dropped [1]. A simple moving average sums the last x closes and divides by x [2]. The 50-day and 200-day lines summarize the past and cannot predict future prices [3].
Key points
- A simple moving average (SMA) adds the last x closing prices and divides by x [2].
- Each new day's close enters the average and the oldest one leaves [1].
- An exponential moving average (EMA) gives recent prices more weight than old ones [2].
- Longer averages are smoother and slower. In our example a 5-day average took 5 days to catch up with a price jump (calculated).
- Crossovers are read by traders as signals, but past performance cannot predict future results [3].
On this page
What is a moving average on a stock chart?#
A moving average is an average of a security's prices over a period that can be as short as a few days or as long as several years, used in charts to show the trend over the latest interval [1]. It is called moving because the window slides forward: as each new price is included, the oldest one in the series is dropped [1].
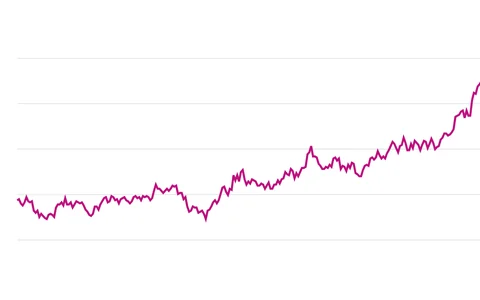
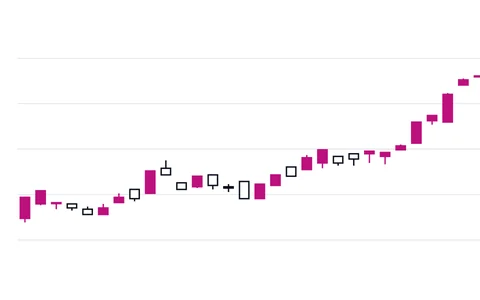
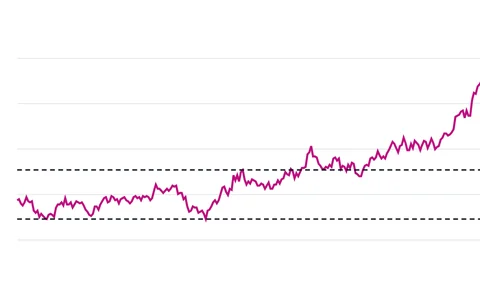
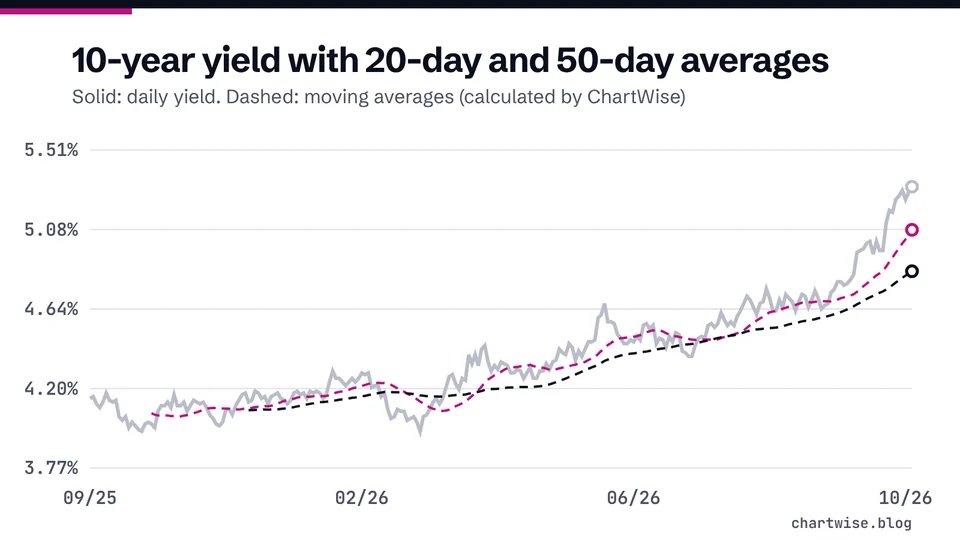
On a chart it appears as a smooth line drawn over the price, often over candlesticks. Each point on that line is the average of the closes in the window ending that day. A 50-day line uses the last 50 trading days; a 200-day line uses the last 200.
If the price axis and time windows are still new, read how to read a stock chart first.
How is a simple moving average calculated?#
A simple moving average is calculated by summing the closing prices of the last x days and dividing by the number of days [2]. Here is a 5-day version for a hypothetical stock, so the arithmetic stays short. A 50-day or 200-day average works the same way with more numbers.
The table lists eight daily closes and the 5-day average once five closes exist.
| Trading day | Close | 5-day SMA |
|---|---|---|
| Day 1 | $20.10 | Not enough data |
| Day 2 | $20.40 | Not enough data |
| Day 3 | $20.25 | Not enough data |
| Day 4 | $20.60 | Not enough data |
| Day 5 | $20.80 | $20.43 |
| Day 6 | $21.05 | $20.62 |
| Day 7 | $20.90 | $20.72 |
| Day 8 | $21.30 | $20.93 |
Hypothetical stock. Averages calculated in code with the simple moving average method in [2].
- Add the first five closes
$20.10 + $20.40 + $20.25 + $20.60 + $20.80 = $102.15 (calculated).
- Divide by five
$102.15 / 5 = $20.43, the 5-day SMA on day 5 (calculated).
- Slide the window
On day 6, drop day 1's $20.10 and add $21.05 [1]. The new sum is $103.10 and the average $20.62 (calculated).
- Repeat each day
Join the daily averages and you have the moving average line.
What is the difference between a simple and an exponential moving average?#
A simple moving average gives every close in the window the same weight. An exponential moving average assigns more influence to recent numbers and less to old data, through a weighting variable in the calculation [2].
Chart settings usually let you pick SMA or EMA and the number of periods. A "50-day" line on one site may be simple and on another exponential, so the two lines will not match exactly. Check the indicator label before comparing.
What do the 50-day and 200-day moving averages show?#
They show where the price has been on average over two different spans. The 50-day line follows roughly the last few months of trading; the 200-day line covers a much longer stretch, so it is smoother and turns more slowly.
Traders often compare the current price with these lines, and moving averages are often used to judge where price sits relative to support and resistance on a chart [2]. Our explainer on support and resistance covers what those terms mean and their limits.
When one moving average line crosses another, traders call it a crossover and use it as a bullish or bearish signal [2]. A shorter average crossing above a longer one is generally seen as bullish, and crossing below as bearish [2]. These two events are sometimes nicknamed the golden cross and the death cross. A crossover is a description of averages of past prices, not a forecast. The SEC states that past performance cannot predict how an investment strategy will perform in the future [3].
- 50-day moving average
- $82.40hypothetical example
- 200-day moving average
- $78.15hypothetical example
- Price vs 50-day line
- -2.79%($80.10 - $82.40) / $82.40 x 100, calculated
- Price vs 200-day line
- +2.5%($80.10 - $78.15) / $78.15 x 100, calculated
In this example the price is 2.79% below its 50-day line and 2.5% above its 200-day line (calculated). That tells you the price has dipped recently compared with the last few months, but is still above its longer average. It does not tell you what happens next.
Why does a moving average always lag behind the price?#
Because it is built only from past closes. When the price changes suddenly, old prices stay inside the window until they are pushed out one by one [1].
Imagine a hypothetical stock that closes at $20.00 for five days, then jumps to $24.00 and stays there. The 5-day average climbs in steps of $0.80 and only reaches $24.00 on the fifth day after the jump (calculated). A 50-day average would take 50 trading days to fully catch up, and a 200-day average 200.
Mistakes beginners make with moving averages#
- Comparing an SMA with an EMA
An EMA weights recent prices more [2], so a 50-day EMA and a 50-day SMA will differ. Check the label.
- Forgetting the lag
A 5-day average needed five days to catch a jump in our example (calculated). Longer averages trail even more.
- Trusting back-tested results
Back-tested performance is hypothetical and does not reflect actual performance [3]. A rule that looks great on old charts may not work going forward.
- Ignoring the business
A line of averaged prices says nothing about revenue, debt or cash. Any stock can lose value [4].
Frequently asked questions#
How do you calculate a 50-day moving average?
Which is better, SMA or EMA?
Neither is better in general. An EMA gives recent prices more weight [2]; an SMA weights every close in the window equally. Use the one your chart labels clearly and compare like with like.
What does it mean when the 50-day crosses above the 200-day?
Why does my moving average differ from another website's?
Sites can use different types (simple or exponential), different period lengths, or different closing prices. Check the indicator settings.
The bottom line#
A moving average is a rolling average of past closes: add the last x, divide by x, slide forward a day and repeat. That makes it a tidy summary of trend and a slow one, because every new price has to push an old one out. Use the 50-day and 200-day lines to see where today's price sits against recent history, not as a prediction. Next, read about support and resistance or return to the stock charts hub.
Sources
Education only. This page is not investment, tax or legal advice. Stocks can lose value. See our risk disclosure.