Explainer · Reading a Stock Page
Market cap explained: what a company is worth on paper
Market cap is the share price multiplied by the number of shares. It tells you how big a company is in the stock market's eyes today, not what it would sell for or how safe it is.
Quick answer
Market capitalization is the current share price multiplied by the total number of shares outstanding [1]. It measures company size in the stock market. It changes whenever the price changes and is not the same as cash value or a sale price.
Key points
- Market cap = share price x shares outstanding [1].
- Share price alone says nothing about size. A $15 stock can belong to a company 15 times larger than a $40 stock (calculated).
- Labels like large-cap and microcap have no single legal cut-off. The SEC says companies under $250 or $300 million are often called microcaps [6].
- Index providers such as S&P Dow Jones Indices weight by float-adjusted market cap, which leaves out shares held by strategic holders [7] [8].
- Bigger does not mean safe. Large company stocks as a group have lost money in about one year out of three on average [5].
On this page
What is market capitalization?#
Market capitalization, usually shortened to market cap, is the value the stock market puts on a company's shares at a given moment. Investor.gov defines it as the current market price of one share multiplied by the number of total outstanding shares [1]. Nasdaq describes it the same way and calls it a measure of corporate size [2].
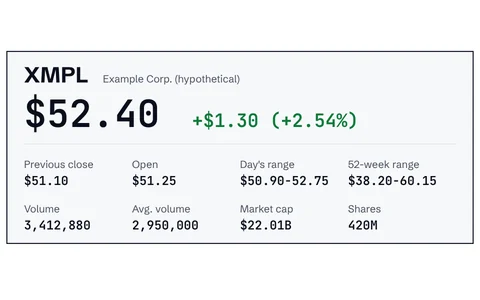
On a stock page, market cap usually sits in the statistics block under the price, next to P/E and dividend yield. Our guide on how to read a stock quote shows where it fits among the other lines.
market cap = share price x shares outstanding
How do you calculate market cap?#
You need two numbers: the share price and the number of shares outstanding. Multiply them. The steps below use two hypothetical companies to show why the share price on its own can mislead you.
- Find the share price
Company A trades at $40 a share. Company B trades at $15 a share. Both are hypothetical.
- Find the shares outstanding
Company A has 50 million shares outstanding. Company B has 2 billion.
- Multiply
Company A: 50 million x $40 = $2 billion. Company B: 2 billion x $15 = $30 billion (calculated).
- Compare sizes, not prices
Company B has the lower share price but a market cap 15 times larger than Company A (calculated).
- Company A market cap
- $2 billion50 million shares x $40, calculated
- Company B market cap
- $30 billion2 billion shares x $15, calculated
- B compared with A
- 15 times largercalculated
Where does the share count come from?#
Public companies report it. The cover page of the annual Form 10-K asks a company to state the number of shares outstanding of each class of common stock, as of the latest practicable date [4]. Information on public companies, including these filings, can be found on the SEC's EDGAR system [5].
The same cover page also asks for the market value of common equity held by non-affiliates, measured as of the last business day of the company's second fiscal quarter [4]. That is a different number from the market cap on a quote page, taken on a different date, so do not expect them to match.
Quote sites may take the share count from different filings or refresh it at different times, so two stock pages can show slightly different market caps for the same company on the same day.
What do large-cap, mid-cap and microcap mean?#
Investor.gov groups stocks as large-cap, mid-cap and small-cap, and says shares of very small companies are sometimes called microcap stocks [5]. It gives dollar figures only for the smallest groups: companies under $250 or $300 million are often called microcaps, and those under $50 million are sometimes called nanocaps [6].
For the bigger groups there is no official line. One public reference point is the eligibility rule of the S&P Composite 1500 indexes. In S&P Dow Jones Indices' July 2026 methodology, a company needs a market cap of at least US$22.7 billion for the S&P 500, US$8.0 billion to US$22.7 billion for the S&P MidCap 400 and US$1.2 billion to US$8.0 billion for the S&P SmallCap 600 [7]. Those ranges took effect on July 1, 2025 and are reviewed at the start of each calendar quarter [7].
The table puts these reference points side by side. Remember that the S&P figures are entry rules for one family of indexes, not a legal definition.
| Label | Rough market cap | Where the figure comes from |
|---|---|---|
| S&P 500 eligible | US$22.7 billion or more | S&P U.S. Indices methodology, July 2026 |
| S&P MidCap 400 eligible | US$8.0 billion to US$22.7 billion | S&P U.S. Indices methodology, July 2026 |
| S&P SmallCap 600 eligible | US$1.2 billion to US$8.0 billion | S&P U.S. Indices methodology, July 2026 |
| Microcap | Under $250 or $300 million | Investor.gov: "often called" |
| Nanocap | Under $50 million | Investor.gov: "sometimes referred to" |
Sources: S&P Dow Jones Indices [7]; Investor.gov [6].
What is float-adjusted market cap?#
Not every share is available to ordinary investors. Under S&P Dow Jones Indices' float adjustment, index share counts reflect only the shares available to investors rather than all shares outstanding [8]. The share that is available is called the investable weight factor (IWF): available float shares divided by total shares outstanding [8].
Shares held by strategic holders are left out. S&P's list includes officers and directors, other publicly traded companies, government entities and any individual listed as a 5% or greater stakeholder [8]. The S&P U.S. indexes are weighted by this float-adjusted market cap [7], so a company's index weight is based on its float-adjusted value rather than its full market cap. Read more in what is a stock index.
Does a bigger market cap mean a safer stock?#
Size changes the kind of risk, not whether there is risk. FINRA notes that large-cap stocks are usually more liquid than small- or micro-cap stocks [9]. FINRA describes liquidity as being able to buy and sell quickly without significantly affecting prices [10].
At the small end, the SEC says the biggest difference between microcap stocks and other stocks is often how much reliable public information exists about the company [11]. Because many microcaps trade in low volumes, any size trade can move the price by a large percentage [11], and microcaps may be susceptible to fraud and manipulation [11].
But large companies fall too. Investor.gov notes that large company stocks as a group have lost money on average about one out of every three years [5]. Market cap tells you the size of the company. It does not tell you whether the price is fair, and it is not a reason to buy.
Mistakes beginners make with market cap#
- Judging size by share price
A $15 share can belong to a company far bigger than a $40 share. Always multiply by shares outstanding [1].
- Treating market cap as a sale price
Market cap prices every share at the current market price [1]. It is not a price anyone has agreed to pay for the whole company.
- Thinking a cheap-looking stock has more room to grow
A low share price is not a sign of upside. A $2 stock with a tiny market cap may be a microcap with thin trading and limited information [11].
- Assuming large-cap means low risk
Large company stocks as a group have lost money in about one year out of three on average [5].
- Comparing caps from different dates
A filing's non-affiliate market value is measured at the end of the second fiscal quarter [4]. Compare like with like.
Frequently asked questions#
Is market cap the same as what a company is worth?
Why did market cap change when the company did nothing?
Because the share price moved. With the share count unchanged, a 10% price rise lifts market cap by 10%. In our example $15 billion became $16.5 billion (calculated).
What market cap counts as a microcap?
Investor.gov says companies under $250 or $300 million are often called microcap stocks, and those under $50 million are sometimes called nanocaps [6]. These are common labels, not legal limits.
Why does the market cap differ between two websites?
Sites may use share counts from different filings or update them at different times. The 10-K cover page gives shares outstanding as of the latest practicable date [4]; a site using an older filing will show an older count.
The bottom line#
Market cap is a quick way to see how big a company is in the stock market: price times shares outstanding, nothing more. Use it to compare companies, not share prices, and remember it moves every time the price moves. Size labels are conventions, index providers adjust for float, and no market cap makes a stock safe. Next, see what volume and average volume tell you, or go back to the reading a stock page hub.
Sources
- Market Capitalization.
- Market capitalization Definition.
- Understanding Order Types | Investor.gov.
- Form 10-K (SEC 1673 (02-25)).
- Stocks - FAQs.
- Microcap stock.
- S&P Dow Jones Indices: Index Methodology, S&P U.S. Indices (July 2026).
- S&P Dow Jones Indices: Index Methodology, S&P Float Adjustment (April 2026).
- Understanding Market Liquidity and Your Investments.
- Key Terms for Tough Times: The Vocabulary of Stressed Markets.
- Investor Bulletin: Microcap Stock Basics (Part 1 of 3: General Information).
Education only. This page is not investment, tax or legal advice. Stocks can lose value. See our risk disclosure.