Explainer · Reading a Stock Page
Volume and average volume: what the numbers mean
Volume tells you how many shares changed hands. Read next to average volume, it shows whether today is a normal day and how easy the stock may be to trade.

Quick answer
Volume is the number of shares traded in a period, usually one day, counted once per trade [1]. Average volume is the typical daily figure over a look-back period. Higher volume generally means a more liquid stock [6], but volume never tells you which way the price will move.
Key points
- If A sells 100 shares to B, volume is 100 shares, not 200 [1].
- Average volume is a typical day over a look-back window. An SEC rule on company buybacks, for example, uses the four calendar weeks before the purchase week [4].
- Today's volume divided by average volume shows whether trading is unusually busy (calculated in our example).
- Low volume can make it hard to sell when you want, and any size trade can move the price a lot [7].
- A volume spike shows more trading, not more buyers. Every share bought was also sold.
On this page
What does volume mean on a stock page?#
Volume is the number of shares that traded. Nasdaq defines trading volume as the number of shares transacted every day, and points out that each trade has a buyer and a seller: if A sells 100 shares to B, the volume is 100 shares [1].
Trades away from the listing exchange are reported too. Trades in listed stocks on alternative trading systems, including dark pools, must be reported to a FINRA Trade Reporting Facility and are published on the consolidated tape [2].
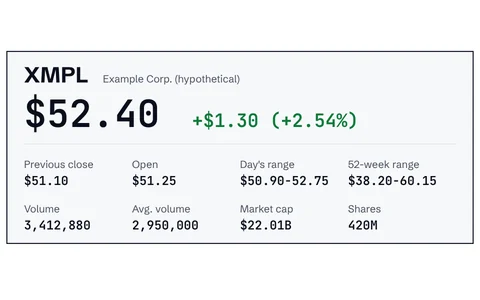
On a quote page, volume usually sits next to average volume in the statistics block. During the session it is usually a running total, so a 10:00 a.m. figure may cover little more than the first half hour after the 9:30 a.m. open [3]. Our guide on how to read a stock quote shows where it sits among the other lines.
How is average volume calculated?#
Average volume adds up daily volume over a look-back period and divides by the number of trading days. Each quote site picks its own window and usually labels it, for example 10 days or 3 months, so check the label before comparing two sites.
Regulators use averages too. SEC Rule 10b-18, a safe harbor for companies buying back their own stock, defines average daily trading volume (ADTV) as the average daily volume reported during the four calendar weeks before the week of the purchase [4]. Under that rule a company's qualifying purchases on a single day must not exceed 25 percent of ADTV [4].
The table shows a hypothetical stock over five days, followed by a busy sixth day.
| Trading day | Shares traded | Note |
|---|---|---|
| Day 1 | 2,140,000 | Normal day |
| Day 2 | 1,980,500 | Normal day |
| Day 3 | 2,310,200 | Normal day |
| Day 4 | 2,055,300 | Normal day |
| Day 5 | 2,198,600 | Normal day |
| Five-day average | 2,136,920 | Sum of days 1 to 5 divided by 5 (calculated) |
| Day 6 (today) | 5,870,000 | 2.75 times the five-day average (calculated) |
Hypothetical stock. All figures invented for teaching and calculated in code.
How do you read today's volume against the average?#
Divide today's volume by average volume. Traders call the result relative volume. A figure near 1 is an ordinary day; a figure well above 1 means unusually busy trading.
You can also turn volume into dollars by multiplying shares traded by the share price. That helps when you compare a $5 stock with a $500 stock, because the same number of shares means very different amounts of money.
- Check the time
Volume during the session is a running total. Compare a midday number with a full-day average and today will look quiet.
- Read the average's window
Look for the label (10-day, 3-month and so on). Different windows give different averages.
- Divide
Day 6 volume 5,870,000 / average 2,136,920 = 2.75 (calculated).
- Look for the reason
Check the company's news and filings. A spike tells you something happened, not what it means for the price.
- Relative volume
- 2.755,870,000 / 2,136,920, calculated
- Dollar volume today
- $107,127,5005,870,000 x $18.25, calculated
- Typical dollar volume
- $38,998,7902,136,920 x $18.25, calculated
Why does low volume matter to a small investor?#
Volume is closely tied to liquidity, which FINRA describes as being able to buy and sell quickly without significantly affecting prices [5]. Securities with higher trading volume are generally more liquid, and executing a large order quickly in a low-volume security can be difficult [6].
Thin trading can also cost money. FINRA notes that illiquid investments often have a wide bid-ask spread and that you might have to accept a lower price if you need to sell quickly, or might not be able to sell at all [6]. The bid-ask spread explainer shows what that costs.
The SEC makes the same point about microcap stocks: low trading volume may make it difficult to sell when you want to, and because many trade in low volumes, any size trade can have a large percentage impact on the price [7]. See market cap explained for what counts as a microcap.
What can a volume spike tell you, and what can it not?#
A spike tells you that many more shares changed hands than usual. It does not tell you why, and it does not tell you what comes next.
Be most careful with spikes in small, low-priced stocks. FINRA has historically seen fraudsters target low-priced microcap stocks trading over the counter [8]. In a pump-and-dump, promotion draws in other investors who may buy and push the price higher, then the promoters sell, and the selling and price crash often happen very rapidly, sometimes in seconds [8]. Read more in investment scams and pump-and-dumps.
Volume outside regular hours is a separate case. Extended-hours trading might offer less liquidity because fewer transactions occur outside regular hours [6], and the SEC says the reduced trading interest generally results in wider spreads or no quotes at all [9].
Mistakes beginners make with volume#
- Reading high volume as "buying pressure"
Every share bought was sold by someone [1]. Volume measures activity, not direction.
- Comparing a midday total with a full-day average
Volume builds through the session. Early in the day almost every stock looks quiet.
- Ignoring the average's window
A 10-day and a 3-month average can differ a lot. Check the label before comparing sites.
- Buying a stock you cannot easily sell
In low-volume stocks it may be difficult to sell when you want to [7]. Check average volume before you buy, not when you need out.
- Chasing a spike in a tiny stock
FINRA has historically seen pump-and-dump fraudsters target low-priced microcap stocks [8]. Find out why the stock is busy first.
Frequently asked questions#
Does volume count both the buyer and the seller?
No. Nasdaq's example: if A sells 100 shares to B, the volume is 100 shares [1].
Is high volume good or bad?
Neither on its own. Higher volume generally means a more liquid stock [6], which helps when you trade. It does not say whether the price will rise or fall.
Why is average volume different on two websites?
Sites use different look-back windows, such as 10 days or 3 months. A regulator's definition can differ again: SEC Rule 10b-18 uses four calendar weeks [4].
Do dark pool trades count in volume?
Trades in listed stocks on alternative trading systems, including dark pools, are reported to FINRA and published on the consolidated tape [2].
The bottom line#
Volume is a count of shares traded, once per trade. Average volume puts that count in context, and today's volume divided by the average shows whether the day is unusual. Use volume to judge how easy a stock may be to trade, especially before buying something small and thinly traded. Do not read it as a signal: a spike says something happened, not what to do. Next, see the bid-ask spread or go back to the reading a stock page hub.
Sources
- Trading volume Definition.
- Where Do Stocks Trade?.
- Holidays & Trading Hours.
- 17 CFR 240.10b-18 Purchases of certain equity securities by the issuer and others.
- Key Terms for Tough Times: The Vocabulary of Stressed Markets.
- Understanding Market Liquidity and Your Investments.
- Investor Bulletin: Microcap Stock Basics (Part 1 of 3: General Information).
- Avoiding Pump-and-Dump Scams.
- Extended-Hours Trading: Investor Bulletin.
- Stocks - FAQs.
Education only. This page is not investment, tax or legal advice. Stocks can lose value. See our risk disclosure.