Calculator
Position size calculator
Decide the most you are willing to lose on one stock before you buy it. This calculator turns that amount and your stop price into a whole number of shares.
Quick answer
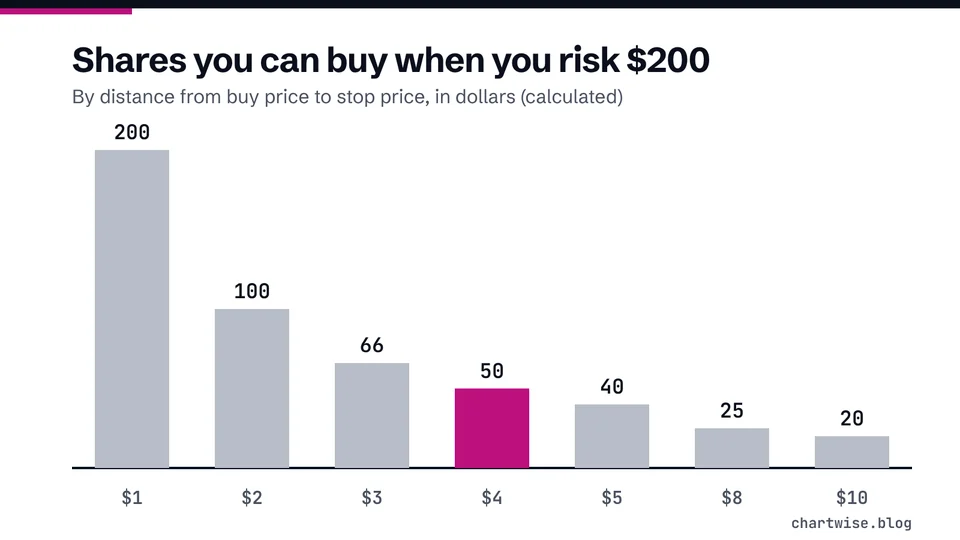
Shares = (account × risk %) / (buy price - stop price), rounded down. With $20,000, 1% risk, a $50 buy and a $46 stop you buy 50 shares and plan to lose $200 (calculated). A stop can fill below its price [3].
This calculator needs JavaScript. The formula and a worked example below show the same calculation by hand.
Key points
- The share count comes from the loss you accept, not from how much you want to own.
- A stop order becomes a market order when triggered, so the real loss can be larger than planned [2].
- Check what share of your account the position uses; a small planned loss can sit inside a large position.
On this page
How does the position size calculator work?#
It applies one formula. First it multiplies your account size by the percentage you are willing to lose to get the amount at risk. Then it divides that amount by the gap between your planned buy price and your stop price, which is what each share loses if you sell exactly at the stop. It rounds the answer down to whole shares, so the planned loss never goes above the amount you chose.
shares = (account × risk %) / (buy price - stop price), rounded down
It also shows the planned loss for that whole number of shares, the cost of the shares and what percentage of your account that cost represents. The last figure matters: a position can carry a small planned loss and still be a large slice of everything you own. FINRA describes concentration risk as the risk of amplified losses from holding a large portion of your holdings in one investment [1].
Can you check the result by hand?#
Keep the account at $20,000 and the risk at 1%, then move only the stop. The table below shows how the share count changes. Every row plans the same $200 loss if the stop fills at its price.
| Stop price | Risk per share | Shares | Cost of shares | Share of account |
|---|---|---|---|---|
| Stop at $48 | $2 | 100 | $5,000 | 25% |
| Stop at $46 | $4 | 50 | $2,500 | 12.5% |
| Stop at $45 | $5 | 40 | $2,000 | 10% |
| Stop at $40 | $10 | 20 | $1,000 | 5% |
Account $20,000, risk 1% ($200), buy price $50. All values calculated.
What does the calculator not account for?#
- Fills below your stop. When the stop price is reached, a stop order becomes a market order, and the price you get may differ from the stop, especially in a fast-moving market [2]. If the 50 shares in the example sold at $44 instead of $46, the loss would be $300, or 1.5% of the account (calculated).
- Short-lived swings. A brief dip can trigger a stop, and FINRA notes the stock might later rebound to its prior price level [3].
- Costs and taxes. Commissions, the bid-ask spread and taxes are not included.
- Whether a stop belongs there at all. The calculator does the arithmetic. It cannot tell you where a sensible stop is; our guide to support and resistance explains why chart levels are zones, not exact prices.
How do you choose the risk percentage?#
The SEC and FINRA sources we cite give no fixed figure. The SEC describes risk tolerance as your ability and willingness to lose some or all of your original investment in exchange for greater potential returns [4]. That is personal, so the 1% default is only a starting point that makes the arithmetic easy to follow.
Sizing one position is not the same as spreading risk. The SEC's beginners' guide says diversification is spreading money among different investments to reduce risk [4]. Read diversification explained and stock market risk explained for the bigger picture.
Frequently asked questions#
Why does a closer stop give me more shares?
Because the amount at risk stays the same. If each share can only lose $2 instead of $4, you can hold twice as many shares for the same planned loss. The position gets bigger, and an ordinary dip is more likely to reach the stop.
Is the planned loss the most I can lose?
No. It assumes you sell exactly at the stop price. A stop order becomes a market order once triggered, and the fill can be markedly different from the stop price [3]. And if you never sell, there is no limit short of the whole investment: the SEC reminds investors that you can lose money you invest in stocks [5].
Does the calculator place a stop order for me?
No. It only does arithmetic in your browser. You decide whether to use a stop order at all, and you enter any order with your broker.
Why are the shares rounded down?
Rounding up would push the planned loss above the amount you chose. Rounding down keeps it at or below that amount, which is why the planned loss can be slightly under your target, for example $199.50 instead of $200 with a $46.50 stop (calculated).
The bottom line#
Pick the loss first, set the stop where your reason for owning the stock would be proven wrong, then let the calculator give you the share count. Treat the planned loss as a plan, not a promise, and read the risk disclosure before you trade.
Sources
Education only. This page is not investment, tax or legal advice. Stocks can lose value. See our risk disclosure.