Glossary
Beta
When a stock page lists a beta, it is a single number that tries to answer one question: when the market moved, how much did this stock tend to move with it?
Beta is a number that compares a stock's past price moves with those of a benchmark index, which is given a beta of 1. Above 1 means the stock has historically moved more than the index; below 1 means less.
Quick answer
Beta compares a stock's movements with a benchmark index, which has a beta of 1. FINRA's example: a beta of 1.2 means the stock has historically moved 120 percent for every 100 percent move in an index such as the S&P 500 [1].
Key points
On this page
What does beta tell you about a stock?#
FINRA explains that beta compares the movements of an individual security against those of a benchmark index, which is assigned a beta of 1 [1]. A stock with a beta of 1.2 has historically moved 120 percent for every 100 percent move in a benchmark such as the S&P 500, so it has been more sensitive to market moves [1]. A stock with a beta of 0.85 has historically moved less than the index [1].
The word that matters is "historically". Beta describes a past relationship. It is a way to read how a stock has behaved next to the market, not a forecast.
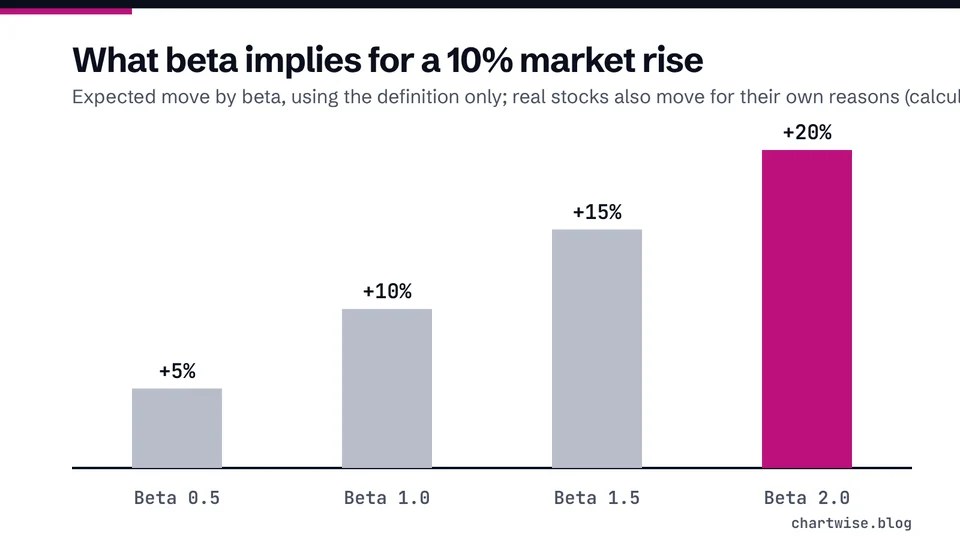
Here is how that past relationship works out on simple numbers, assuming it held exactly: the stock's move equals beta times the index's move, for an index rise of 10% and a fall of 5%.
| Beta | Index +10% | Index -5% |
|---|---|---|
| Beta 1.2 | +12% | -6% |
| Beta 1.0 (the index) | +10% | -5% |
| Beta 0.85 | +8.5% | -4.25% |
Illustration only, calculated as beta x index move. Real stocks also move for their own reasons, because beta describes only how a stock moves relative to the market [1].
How is beta calculated?#
Index providers publish their method. S&P Dow Jones Indices defines beta as the slope of the regression line of a stock's trailing past-year price returns against the daily price returns of a benchmark index over the same period [2]. For U.S. indices it uses daily price changes over the prior 252 days [2]. Its S&P 500 High Beta Index holds the 100 S&P 500 stocks most sensitive to changes in market returns [2].
Other websites may use weekly or monthly returns, a different period or a different index, so the same stock can show different betas on different pages.
What does beta not tell you?#
FINRA stresses that beta measures how a stock moves relative to the market, not its total volatility, and that a stock can have high volatility but a low beta if its movements do not correlate with market moves [1]. A small company whose price jumps on its own news can fit that description.
Beta also says nothing about the business itself: its profits, debts or prospects. Read it alongside the rest of the page, as our guide to reading a stock page suggests, and treat a low beta as a description of the past, not as a promise of safety. Stocks with any beta can lose value.
Frequently asked questions#
What is a good beta for a stock?
There is no good or bad beta. A beta above 1 means the stock has historically moved more than the market, and below 1 means less [1]. Which suits you depends on how much swing you can live with.
Why does beta differ between websites?
Providers can use different periods, return frequencies and benchmarks. S&P Dow Jones Indices, for example, uses 252 days of daily price changes for U.S. indices [2]; another site may use monthly data over several years.
Can a stock have high volatility and low beta?
Yes. FINRA notes that a stock can have high volatility but a low beta if its movements do not correlate with market moves [1].
The bottom line#
Beta is a quick way to see how a stock has moved alongside the market, measured against an index with a beta of 1. Check which period and index a page used, remember it looks backward, and pair it with volatility and the company's own numbers. To measure a single move, use the percentage change calculator.
Sources
Education only. This page is not investment, tax or legal advice. Stocks can lose value. See our risk disclosure.