Calculator
Percentage change calculator
Enter a starting price and an ending price. The calculator returns the percentage change, the gain the stock would need to get back to where it started, and, if you add the years between the prices, the compound yearly rate.
Quick answer
Percentage change = (end price - start price) / start price x 100 [1]. A stock that falls from $50 to $40 has changed -20%, and it needs a 25% gain from $40 to get back to $50 (calculated).
This calculator needs JavaScript. The formula and a worked example below show the same calculation by hand.
Key points
- Divide the change by the starting price, then multiply by 100; this is the method the BLS uses for its own data [1].
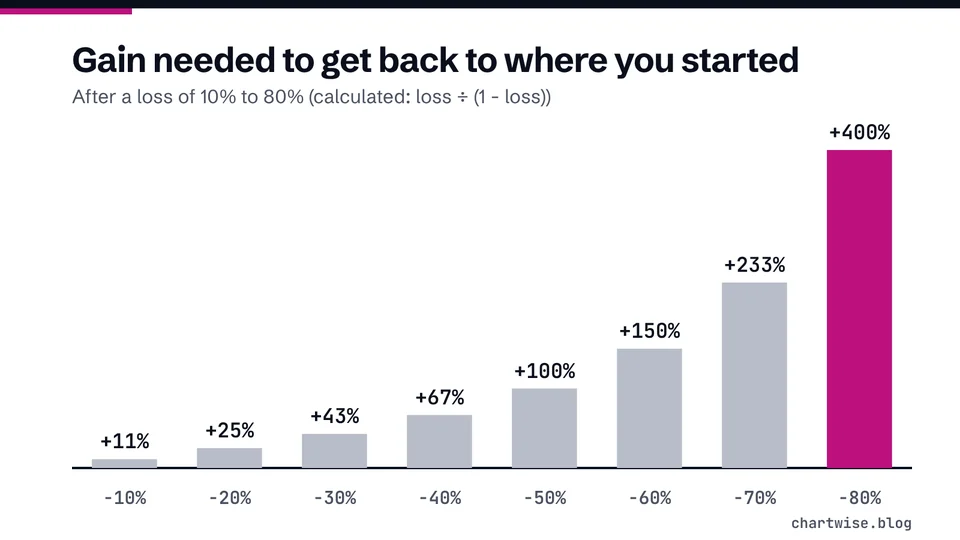
- Losses and gains are not symmetrical: a 20% fall needs a 25% rise to recover (calculated).
- Percentages let you compare moves in stocks at very different prices; point changes do not [1].
On this page
How does the calculator work?#
It applies the standard percent change method. The U.S. Bureau of Labor Statistics describes it for its price indexes: subtract the earlier value from the later one, divide that difference by the earlier value, and multiply the result by 100 [1]. The same arithmetic works for any two stock prices.
percentage change = (end - start) / start x 100
If the price fell, the calculator also shows the gain needed from the end price to get back to the start: (start - end) / end x 100. If you enter the number of years between the two prices, it shows the compound annual rate: ((end / start) ^ (1 / years) - 1) x 100. That is the steady yearly change that would turn the start price into the end price over that time; real prices do not move steadily.
Can you check the result by hand?#
The recovery gain grows faster than the loss. Here is the same $50 starting price with deeper falls. "Gain to recover" is the rise needed from the lower price to get back to $50.
| Price falls to | Change | Gain to recover |
|---|---|---|
| Falls to $45 | -10% | 11.11% |
| Falls to $40 | -20% | 25% |
| Falls to $37.50 | -25% | 33.33% |
| Falls to $25 | -50% | 100% |
| Falls to $12.50 | -75% | 300% |
All values calculated with the same formulas as the calculator.
Why use percentages instead of dollar changes?#
Because a $2 move means very different things for a $10 stock and a $500 stock. The BLS makes the same point about its indexes: point changes are affected by the level of the index, while percent changes are not [1]. Market rules work in percentages too. Market-wide circuit breakers are set at 7%, 13% and 20% declines, calculated from the prior day's closing price of the S&P 500 [2].
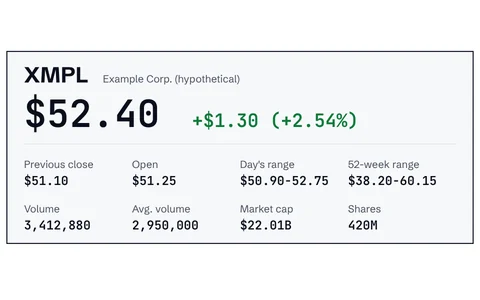
On a stock page, the change figure next to the price is measured from some earlier price. Check the label so you know which starting price the page used. Our guide on how to read a stock quote explains each field.
What does the calculator not tell you?#
- Dividends and costs. It uses prices only. Dividends received, commissions and the bid-ask spread are not included.
- The path. Two stocks can show the same change over a period while one swung far more along the way. FINRA notes that more dramatic swings mean higher volatility and potential risk [3].
- The future. A past percentage change, or a compound annual rate, does not tell you what the next one will be.
Frequently asked questions#
Why does a 50% loss need a 100% gain to recover?
Because the gain is measured from the lower price. From $50 to $25 is -50%. Getting from $25 back to $50 is a $25 rise on a $25 base, which is +100% (calculated).
Is the percentage change the same as my return?
Not exactly. It covers the price move only. Your total result also depends on dividends, fees, taxes and the prices you actually paid and received.
What does the compound annual rate mean?
It is the constant yearly rate that would take the start price to the end price over the years you entered. From $50 to $60 over 3 years it is +6.27% a year (calculated), even if the real price rose in one year and fell in another.
Can I use it for an index or a fund?
Yes. The arithmetic is the same for any two values, which is why the BLS uses it for price indexes [1].
The bottom line#
Use the calculator to put any move on a stock page into percentages, see how far a fallen price has to climb, and turn a multi-year change into a yearly rate. Remember it ignores dividends, costs and the swings in between. To read the moves in context, see volatility and beta.
Sources
Education only. This page is not investment, tax or legal advice. Stocks can lose value. See our risk disclosure.