Glossary
Volatility
Two stocks can end a week at almost the same price and still feel completely different to own. The difference is volatility: how far the price swings along the way.
Volatility is how much and how quickly a stock's or an index's price moves up and down. The bigger the swings, the higher the volatility.
Quick answer
Volatility is the up-and-down movement of stock prices and market indexes. FINRA says the more dramatic the swings, the higher the volatility and potential risk [1]. S&P Dow Jones Indices, for example, measures it as the standard deviation of daily price returns [3].
Key points
On this page
What does volatility mean for a stock?#
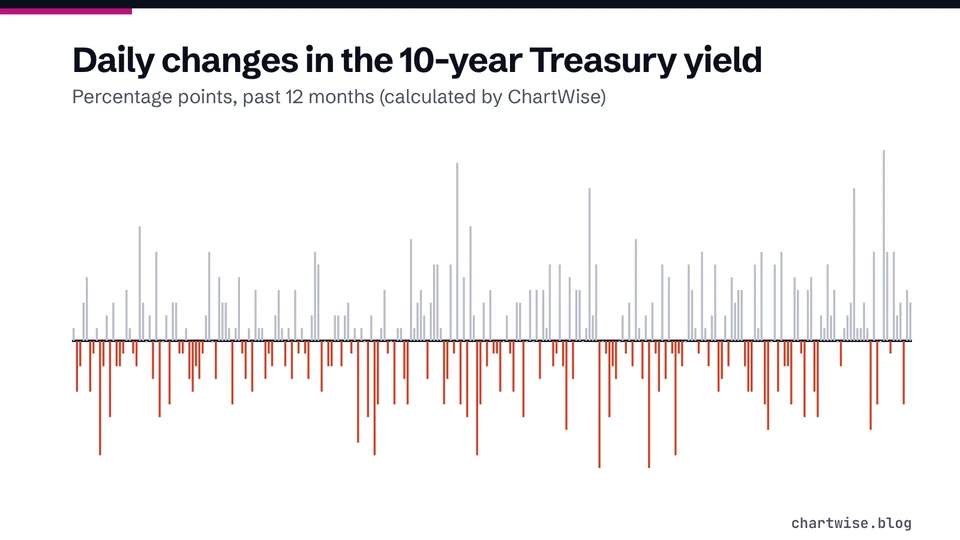
FINRA describes volatility simply: some days market indexes and stock prices move up and other days they move down, and that movement is called volatility [1]. In its guide to stressed markets, FINRA adds that when a security or an index fluctuates wildly in a short period of time, it is experiencing volatility [2]. The more dramatic the swings, the higher the level of volatility and potential risk [1].
Volatility is about the size of the moves, not their direction. A stock can be volatile while drifting up, down or sideways. On a stock chart it shows up as a jagged line with tall daily candles or bars.
Here are five days for two hypothetical stocks that both start at $100. Their daily moves are very different in size.
| Day | Calm stock | Jumpy stock |
|---|---|---|
| Day 1 | +0.5% | +3.0% |
| Day 2 | -0.4% | -2.5% |
| Day 3 | +0.3% | +2.0% |
| Day 4 | -0.2% | -3.5% |
| Day 5 | +0.1% | +1.5% |
| Price after 5 days | $100.30 | $100.33 |
| Std. deviation of daily moves | 0.36% | 2.9% |
Hypothetical stocks. Prices and sample standard deviations calculated.
How is volatility measured?#
One standard yardstick is standard deviation, a statistic for how spread out a set of numbers is. S&P Dow Jones Indices, an index provider, defines a stock's volatility in its low-volatility index rules as the standard deviation of its daily price returns over 252 trading days [3]. Its S&P 500 Low Volatility Index holds the 100 least volatile stocks and gives each a weight inversely proportional to its volatility [3]. Other data providers may use different periods, so compare like with like.
For the market as a whole, you may see the VIX quoted. Cboe describes the VIX Index as a measure of market expectations of near-term volatility conveyed by S&P 500 option prices [4]. It is about the index, not about any single stock.
Why does volatility matter to a beginner?#
Because it decides how much a bad week can hurt if you have to sell. FINRA notes that buy-and-hold investors tend to treat volatility like background noise, but that for investors who need short-term liquidity, for example to buy a house or a car, volatility can be a liability [1]. When markets fall sharply, it is easy to react on impulse and sell [1].
Volatility is not the same as beta, which measures how a stock moves relative to the market [1]. To see how big a move really was, enter the two prices in our percentage change calculator.
Frequently asked questions#
Is high volatility good or bad?
Neither on its own. It means bigger swings in both directions and, as FINRA puts it, higher potential risk [1]. Whether you can live with it depends on when you need the money.
What is the VIX?
Cboe's Volatility Index, a measure of market expectations of near-term volatility based on S&P 500 option prices [4]. It does not measure an individual stock.
Does volatility predict where a stock will go?
No. A volatility figure such as a standard deviation is calculated from past price moves [3]. It describes how much the price has swung, not which way it will move next.
The bottom line#
Volatility tells you how rough the ride has been, not where it ends. Check how a figure was measured, compare stocks over the same period, and match the risk to when you will need the money. For the bigger picture, read stock market risk explained.
Sources
Education only. This page is not investment, tax or legal advice. Stocks can lose value. See our risk disclosure.