Glossary
Total return: price change plus income
A stock's price chart shows only half the story for a company that pays dividends. Total return adds the other half.
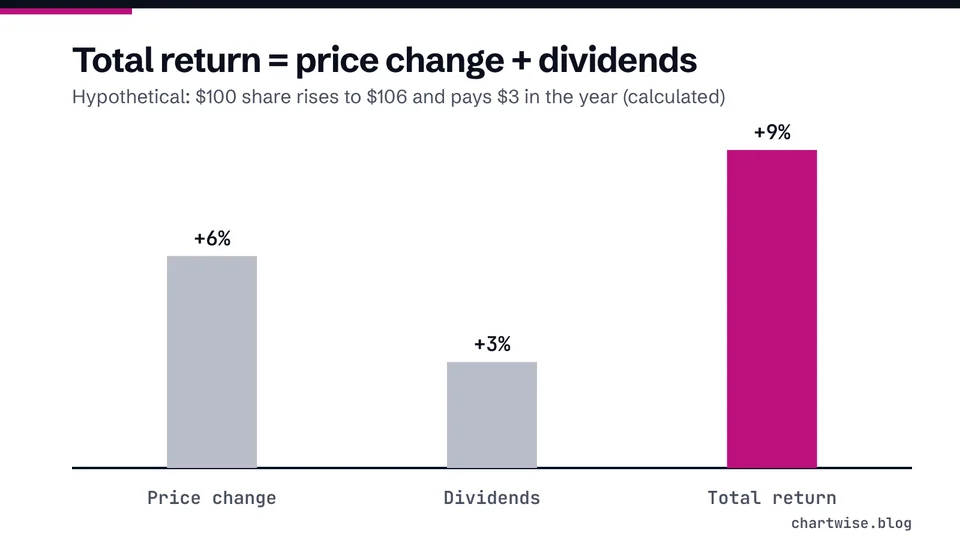
Total return is the full gain or loss on an investment over a period: the change in its value, up or down, plus all the income it paid, such as dividends or interest.
Quick answer
Total return adds an investment's change in value, up or down, to all the income it paid, such as dividends [1]. FINRA calls it generally the most accurate measure of return [1]. Divide by what you paid to express it as a percentage.
Key points
On this page
How do you calculate total return?#
FINRA describes total return, generally considered the most accurate measure of return, as the change in value from the time you bought the investment plus all the income you collected from it in interest or dividends [1]. For a stock, FINRA also puts it the other way round: dividend yield is added to capital gains, or losses, to determine total return [2].
The same holding, measured three ways (calculated from FINRA's example):
| Measure | What it counts | Result |
|---|---|---|
| Price return | $500 rise in value only | 25% over 3 years |
| Total return | $500 rise plus $120 dividends | 31% over 3 years |
| Annualized total return | 31% spread over 3 years | 9.42% a year |
Example from FINRA [1]; price return and annualized figures calculated.
Why annualize total return?#
Because 31% over three years and 31% over ten years are very different results. FINRA says the best way to compare investments held for different periods is the annualized percent return, using AR = (1 + return)^(1 / years) - 1, which gives 9.42 percent in its example [1]. Our percent change calculator gives the same 9.42% a year if you enter $2,000, $2,620 and 3 years (calculated).
FINRA adds three adjustments for a truer picture: include the transaction fees you paid, compute after-tax returns including capital gains and losses, and remember that inflation may play a big role for long holdings [1].
Is an index's total return different from its price?#
Yes. S&P Dow Jones Indices publishes price indices, where changes in the index level reflect changes in stock prices, and total return indices, which reinvest dividend income in the overall index [3]. A net total return version also adjusts each dividend for tax withheld [3]. When you compare a fund or a stock with an index, check which version the chart uses; a total return figure includes dividends that a price index leaves out.
If you reinvest your own dividends through a dividend reinvestment plan, your result moves closer to the total return idea, but it is still not guaranteed. Dividends can be cut or eliminated [4], and prices can fall.
Frequently asked questions#
Can total return be negative?
Yes. Total return adds the change in value, up or down, to the income received [1]. If the price falls by more than the dividends paid, the total return is a loss.
Is dividend yield the same as total return?
No. Yield measures only the income, as a share of the price. Total return adds that income to the capital gain or loss [2]. Try the dividend yield calculator to see the income part on its own.
Does past total return predict future results?
No. A past total return describes what happened over one period. Prices and dividends can change, and dividends on stock are not guaranteed [4].
The bottom line#
Total return is the honest scorecard for a dividend stock: price change plus income, over a stated period, ideally annualized and after fees and tax. Check which version of an index you are comparing against, and read the risk disclosure before investing.
Sources
Education only. This page is not investment, tax or legal advice. Stocks can lose value. See our risk disclosure.