Calculator
Compound growth calculator
Enter a starting amount, what you add each month, an assumed yearly return and a number of years. The calculator shows the end value if that return were steady, and how much of it is growth on top of your own money.
Quick answer
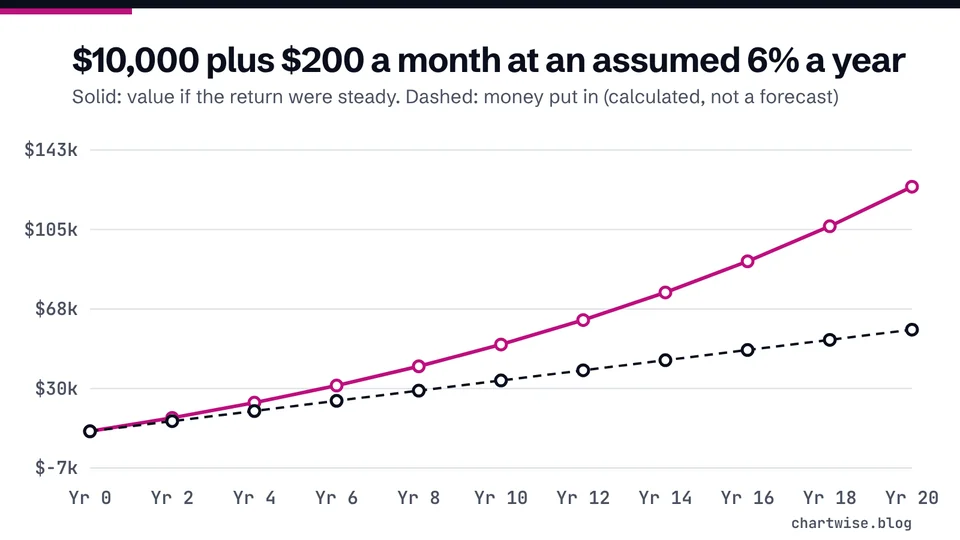
Compounding means you earn returns on your money and on past returns [1]. With $10,000 to start, $200 a month and a steady 6% a year for 20 years, the result is $125,510.22, of which $58,000 is your own money (calculated). Real returns are not steady.
This calculator needs JavaScript. The formula and a worked example below show the same calculation by hand.
Key points
On this page
How does the compound growth calculator work?#
It treats your yearly return as a monthly rate (the yearly figure divided by 12), grows the starting amount month by month, and adds your monthly contribution at the end of each month. Each month's gain is added to the balance, so the next month earns on a slightly larger amount. That is the idea the SEC describes: with compound interest, you earn interest on the money you save and on the interest that money earns [1].
The inputs match those of the SEC's own Investor.gov compound interest calculator: an initial investment, a monthly contribution, a length of time in years and an estimated annual rate [2]. Note the word estimated: the rate is your assumption [2].
end value = start × (1 + r)^n + monthly × ((1 + r)^n - 1) / r, where r = yearly % / 100 / 12 and n = years × 12
If the rate is 0%, the end value is simply the start plus every monthly addition. The calculator also shows the total you put in (start + monthly × n) and the growth, which is the end value minus that total.
Can you check the result by hand?#
The assumed return changes the answer a lot. With the same $10,000 start, $200 a month and 20 years:
| Assumed yearly return | Value after 20 years | Growth |
|---|---|---|
| 0% a year | $58,000.00 | $0.00 |
| 4% a year | $95,580.75 | $37,580.75 |
| 6% a year | $125,510.22 | $67,510.22 |
| 8% a year | $167,072.11 | $109,072.11 |
Growth is the value minus the $58,000 paid in. Steady returns assumed, monthly compounding. All values calculated with the same formula as the tool. Real returns vary year to year and can be negative.
The SEC gives a simpler example with no monthly additions: $365 earning 5% a year grows to $465.84 by the end of 5 years and $1,577.50 by the end of 30 years [1]. About 76.86% of the 30-year figure is growth rather than the original $365 (calculated from the SEC's numbers).
What does the calculator not account for?#
- Uneven returns. The tool assumes the same return every month. A 2011 SEC guide notes the stock market has historically provided around 10% annual returns over the long term, but that the long term can take a rather long time to play out [1]. Large company stocks as a group have lost money on average about one out of every three years [3].
- Losses. When you invest you could lose your principal, the amount you invested [1].
- Fees. The more you pay in fees and expenses, the less money you will have [4]. Use the fund fee calculator to see that effect.
- Inflation and taxes. The SEC notes that real returns, after inflation, have been closer to 6% or 7% than the 10% headline [1]. Taxes are not included either.
Which return should you assume?#
There is no correct number, which is why the Investor.gov calculator lets you add an interest rate variance to see results above and below your main estimate [2]. A practical approach is to run three cases, such as 0%, a modest rate and a higher rate, and plan around the lower ones. Remember that diversification can't guarantee your investments won't suffer if the market drops [1]. For how fees eat into growth, read expense ratios explained, and for spreading risk, diversification explained.
Frequently asked questions#
Is compound growth the same as compound interest?
The arithmetic is the same: you earn on your principal and on accumulated earnings [5]. With stocks, the rate you enter is only an assumption.
Why does the result grow faster in later years?
Because each year's growth is added to the balance and then earns growth itself. With the default inputs, the end value is $50,969.84 after 10 years, $125,510.22 after 20 and $261,128.76 after 30 (calculated).
Can I use this to predict my stock portfolio?
No. It shows what would happen if one return stayed steady. Stocks do not deliver steady returns, and you could lose some or all of your money in any one investment [1].
The bottom line#
Compound growth rewards time, but only on the return you actually earn. Run the calculator with several assumed returns, including 0%, subtract fees with the fund fee calculator, and treat every result as an illustration rather than a forecast.
Sources
Education only. This page is not investment, tax or legal advice. Stocks can lose value. See our risk disclosure.