Explainer · Funds, ETFs & Indexes
Expense ratios explained: the fee you never see
Every mutual fund and ETF charges an expense ratio, but you never get a bill for it. It is taken out of the fund's assets, so the only place it shows up is in a smaller balance.
Quick answer
An expense ratio is the percentage of a fund's average net assets used each year to pay its operating expenses [1]. It is paid out of fund assets, so you pay it indirectly [5]. A 0.57% ratio costs about $57 a year per $10,000 invested (calculated).
Key points
- The expense ratio is a yearly percentage of fund assets that pays for management and other operating costs [1].
- You never pay it directly: it comes out of the fund's assets, so you pay it indirectly [5].
- Every prospectus has a standardized fee table where you can find it [5].
- Small gaps compound. In an SEC example, a 1.00% fee left about $179,000 after 20 years versus about $208,000 with 0.25% [7].
- Brokerage commissions for buying and selling ETF shares are extra and are not in the ratio [4].
On this page
What is an expense ratio?#
The SEC's Investor.gov glossary defines the expense ratio as the percentage of a fund's average net assets used each year to pay the fund's operating expenses [1]. Those expenses can include management fees, distribution and service fees (called 12b-1 fees), acquired fund fees and expenses, and other expenses [1].
FINRA describes it in plain terms: the percentage of the fund's total assets that goes toward paying its recurring fees every year [2]. You can find it in a fund's prospectus, on the fund's website, or in financial publications [2]. If you are new to funds, our guide to index funds explains what you are paying for in the first place.
These two funds are shown only because their filings print the numbers clearly. They are not recommendations, and their fees may have changed since those prospectus dates.
Why don't you see the fee on your statement?#
Because nobody sends you a bill. The fund pays its operating expenses out of its own assets, which means you pay them indirectly [5].
What you do see is the fund's price or net asset value, and that number is already after the fee. A fund that earned 6% before costs and charges 0.75% shows you something close to 5.25%. The 0.75 percentage points never appear as a separate line.
Where do you find a fund's expense ratio?#
In the fee table near the front of the prospectus. A mutual fund is required to disclose its shareholder fees and operating expenses in a standardized fee table [5], and the ETF summary prospectuses quoted on this page contain one too [3]. The line called total annual fund operating expenses is the expense ratio, expressed as a percentage of the fund's average net assets [5].
- Open the summary prospectus
Search the fund's name plus "summary prospectus" on the fund company's site or on the SEC's EDGAR system. The fee table sits in the first pages.
- Find the operating expenses line
Look for "Total annual fund operating expenses". If the table shows a fee waiver, note whether that waiver has an end date.
- Read the example below the table
The example assumes you invest $10,000, earn 5% a year and keep fees unchanged, then shows your costs in dollars [3].
- Compare funds side by side
FINRA's Fund Analyzer lets you calculate how a fund's fees, expenses and discounts affect its value over time [6].
The dollar example in the fee table is the most useful line for a beginner. For the T. Rowe Price ETF above, with its 0.57% expenses, the table shows costs of $58 after 1 year, $183 after 3 years, $318 after 5 years and $714 after 10 years on $10,000 [3]. For the Bridgeway ETF at 0.15%, the costs shown are $15 after 1 year and $48 after 3 years [4].
How much does a small difference cost over time?#
More than the percentages suggest, because the fee comes out every year and the money it removes can no longer grow. The SEC puts it this way: over time, even small ongoing fees have a big impact on your investment portfolio [7]. FINRA adds that a seemingly small difference in fees can eventually add up to thousands of dollars [6].
The SEC's own example uses $100,000 growing 4% a year for 20 years. With a 0.25% annual fee the portfolio ends at approximately $208,000, with 0.50% at approximately $198,000, and with 1.00% at approximately $179,000 [7]. The gap between the cheapest and the most expensive case is about $29,000 (calculated from the SEC's rounded figures).
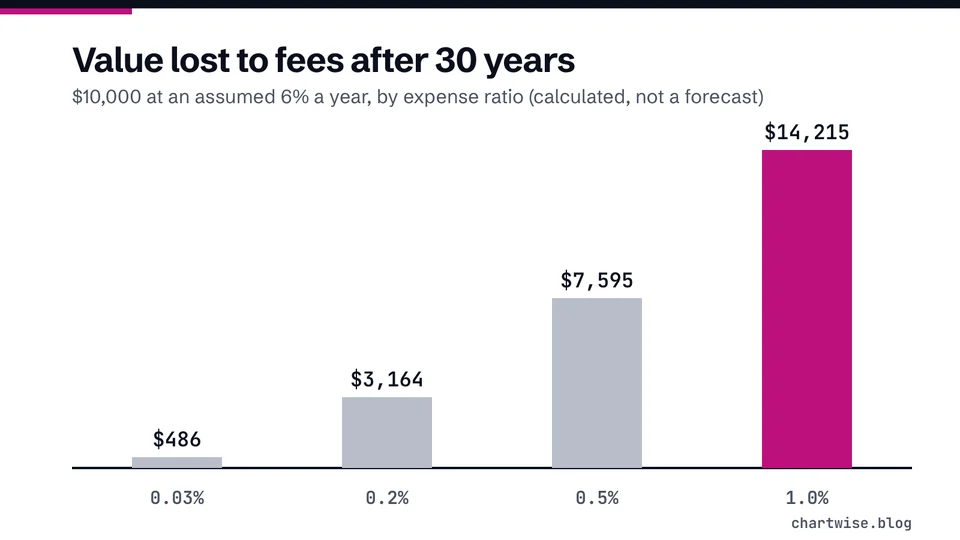
Here is the same idea with our fund fee calculator and its default inputs: $10,000, a hypothetical 6% yearly return before fees, and 30 years. The table shows the end value at four expense ratios.
| Expense ratio | Value after 30 years | Less than at 0.05% |
|---|---|---|
| 0.05% a year | $56,627.69 | $0.00 |
| 0.25% a year | $53,507.08 | $3,120.60 |
| 0.75% a year | $46,415.51 | $10,212.18 |
| 1.00% a year | $43,219.42 | $13,408.26 |
$10,000 invested, hypothetical 6% yearly return before fees, fee subtracted from the return each year. All values calculated. Real returns vary and can be negative.
Why do some funds charge more than others?#
Mostly because of how they are run. FINRA explains that index funds don't need to retain active professional managers and their holdings are traded less often, so they normally have lower operating costs than actively managed funds [2]. Passive funds aim to replicate their benchmark rather than beat it [2].
Paying more does not buy a better result. FINRA notes that in any given year, most actively managed funds don't beat the market, and that their returns are reduced first by the cost of the manager and second by the cost of buying and selling investments [2]. Fees also vary between index funds, which means their returns vary as well [2].
Some funds also charge 12b-1 fees for marketing and distribution. FINRA says these are capped at 1 percent of your assets in the fund [2], and FINRA Rule 2341, as most recently amended effective March 30, 2026, bars FINRA member firms from selling shares of a fund whose asset-based sales charge exceeds 0.75% a year, or whose service fees exceed 0.25%, of its average annual net assets [8]. Both are included in the expense ratio [1]. For how fund types differ beyond fees, see ETFs vs mutual funds.
Mistakes beginners make with expense ratios#
- Ignoring it because it looks tiny
0.75% sounds like nothing, but in the example above it left $10,212.18 less than 0.05% after 30 years (calculated).
- Looking for it on the statement
It is paid out of fund assets, so you pay it indirectly and will not see it as a charge [5].
- Comparing only the headline percentage
Read the dollar example under the fee table and check for fee waivers that may expire. Commissions for trading ETF shares come on top [4].
- Assuming a higher fee means better management
FINRA says most actively managed funds don't beat the market in any given year [2].
- Forgetting the fund can still lose money
A low fee does not protect you from losses. Investing in a mutual fund involves the possibility that you might lose money [2].
Frequently asked questions#
Is the expense ratio charged once a year?
Does the expense ratio include trading commissions I pay?
No. One ETF prospectus we reviewed states that brokerage commissions on buying and selling shares are not reflected in its fee table or example [4].
What is a good expense ratio?
There is no official threshold in the sources we cite. What you can do is compare funds that hold similar investments, read the dollar example in each fee table, and use FINRA's Fund Analyzer to see the effect over time [6].
Can a fund's expense ratio change?
Yes. The fee table example assumes fees remain the same [3], which is an assumption, not a promise. Check the latest prospectus before you invest and again from time to time.
The bottom line#
The expense ratio is the yearly cost of owning a fund, taken quietly from its assets. Find the total annual fund operating expenses line in the prospectus fee table, read the dollar example, and compare funds that hold similar things. Then run your own numbers in the fund fee calculator and see how fees interact with growth in the compound growth calculator. A low fee lowers your costs; it does not remove the risk of loss.
Sources
- Expense Ratio.
- Mutual Funds.
- T. Rowe Price Blue Chip Growth ETF Summary Prospectus (May 1, 2022).
- EA Bridgeway Blue Chip ETF Summary Prospectus (October 11, 2022).
- Investor Bulletin: Mutual Fund Fees and Expenses.
- Compare Funds With FINRA's Fund Analyzer.
- How Fees and Expenses Affect Your Investment Portfolio.
- 2341. Investment Company Securities.
Education only. This page is not investment, tax or legal advice. Stocks can lose value. See our risk disclosure.