Calculator
Fund fee calculator
Enter an amount, an assumed yearly return and the expense ratios of two funds. The calculator shows what each would be worth after the years you choose and how much the higher fee costs.
Quick answer
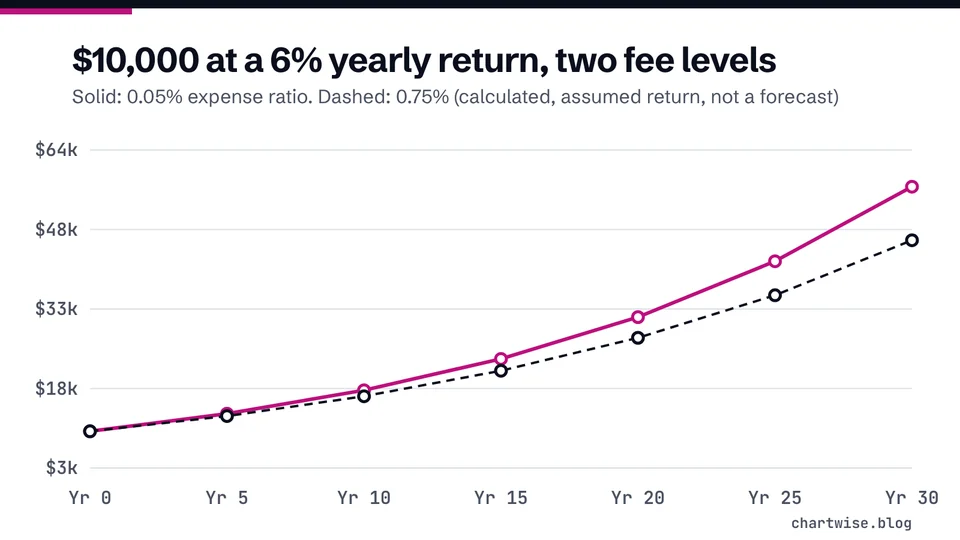
Value = amount × (1 + return - fee) ^ years. With $10,000, a hypothetical 6% return and 30 years, a 0.05% fund ends at $56,627.69 and a 0.75% fund at $46,415.51, a gap of $10,212.18 (calculated). Fees are paid from fund assets [1].
This calculator needs JavaScript. The formula and a worked example below show the same calculation by hand.
Key points
On this page
How does the fund fee calculator work?#
It grows the same starting amount in two funds that earn the same return before fees. Each year, fund A's return is reduced by its expense ratio and fund B's by its own. The calculator then shows both end values, the dollar difference, and how much less fund B ends with as a share of fund A.
That matches how the fee works in real life. Operating expenses are paid out of fund assets, so you pay them indirectly [1], and the more you pay in fees and expenses, the less money you will have in your portfolio [1].
value = amount × (1 + (return % - expense ratio %) / 100) ^ years
The difference is value A minus value B. The last output is that difference divided by value A, so it reads as "fund B ends with this much less than fund A".
Can you check the result by hand?#
Here is how the gap grows with the default inputs at three holding periods.
| Holding period | Fund A at 0.05% | Fund B at 0.75% | Difference |
|---|---|---|---|
| After 10 years | $17,824.18 | $16,680.96 | $1,143.22 |
| After 20 years | $31,770.15 | $27,825.44 | $3,944.70 |
| After 30 years | $56,627.69 | $46,415.51 | $10,212.18 |
$10,000 invested, hypothetical 6% yearly return before fees. All values calculated with the same formula as the tool.
The gap more than doubles between year 20 and year 30 because the money removed by fees would itself have grown. The SEC makes the same point with its own example: $100,000 growing 4% a year for 20 years ends at approximately $208,000 with a 0.25% fee and approximately $179,000 with a 1.00% fee [2]. Our formula gives $208,815.20 and $180,611.12 for those inputs (calculated). The SEC rounds its figures and may deduct fees in a slightly different way, so small differences are expected.
What does the calculator not account for?#
- Real returns move around. The tool uses one steady return. Mutual fund returns aren't guaranteed and you might lose money [3].
- Trading costs. It uses only the expense ratio. Brokerage commissions on buying and selling ETF shares are not in a fund's fee table either [4]; see brokerage fees and costs.
- Fee changes. Fee table examples assume fees remain the same [5]. Real funds can change their fees.
- Taxes and inflation. Both reduce what you keep and are left out.
- Breakpoints and discounts. FINRA's Fund Analyzer can show the effect of breakpoint discounts or waivers on specific funds [6].
Where do you find the expense ratios to enter?#
In each fund's prospectus. A mutual fund must show its operating expenses in a standardized fee table, and the total annual fund operating expenses line is the figure to use, stated as a percentage of average net assets [1]. FINRA notes the expense ratio is also shown on the fund's website and in financial publications [3]. Our explainer on expense ratios walks through the fee table, and index funds explained covers why some funds cost less to run.
Frequently asked questions#
Why use 6% as the default return?
Only as an example input that makes the fee gap easy to see. It is not a forecast. Try 0% or a lower number too, because investors pay fund fees and expenses regardless of how the fund performs [7].
Does the calculator work for ETFs?
Yes. ETFs also show total annual operating expenses in their fee table [4]. Commissions for buying and selling the shares are separate and not included.
Is a lower fee always the better choice?
Fees are one input, not the whole decision. Compare funds that hold similar investments. A cheaper fund with very different holdings is not a like-for-like comparison.
What happens if I enter a 0% return?
Both funds shrink by their fees each year. With $10,000 for 30 years, fund A at 0.05% ends at $9,851.08 and fund B at 0.75% at $7,978.39 (calculated).
The bottom line#
Use the calculator to turn two expense ratios into dollars before you choose between similar funds. Find the total annual fund operating expenses line in each prospectus, keep the return assumption modest, and remember that the result is an illustration, not a promise. For growth with regular contributions, try the compound growth calculator.
Sources
- Investor Bulletin: Mutual Fund Fees and Expenses.
- How Fees and Expenses Affect Your Investment Portfolio.
- Mutual Funds.
- EA Bridgeway Blue Chip ETF Summary Prospectus (October 11, 2022).
- T. Rowe Price Blue Chip Growth ETF Summary Prospectus (May 1, 2022).
- Compare Funds With FINRA's Fund Analyzer.
- Characteristics of Mutual Funds and Exchange-Traded Funds (ETFs).
- Expense Ratio.
Education only. This page is not investment, tax or legal advice. Stocks can lose value. See our risk disclosure.