Company snapshot · MSFT
Microsoft (MSFT): what its filings show
Microsoft reported $331.8 billion of revenue and $133.7 billion of net income for fiscal 2026, which ended June 30, 2026. Here is what drove those totals, what the cash flow shows, and the risks Microsoft lists first.
Quick answer
For fiscal 2026, ended June 30, 2026, Microsoft reported revenue of $331.8 billion, operating income of $155.2 billion [2] and diluted EPS of $17.95, as reported in its Form 10-K. Its Intelligent Cloud segment grew fastest, up 29.7% (calculated).
No share price here on purpose. Prices change every second and we do not have a licensed live feed. Look up the current price with your broker, then use our P/E calculator with the EPS below.
Key figures, fiscal year 2026 (year ended 30 Jun 2026, Form 10-K filed 29 Jul 2026)
- Revenue
- $331.84Breported
- Net income
- $133.75Breported
- Net margin
- 40.3%calculated: net income ÷ revenue
- Diluted EPS
- $17.95reported
- Dividends per share
- $3.64reported, declared
- Payout ratio
- 20.3%calculated: dividends per share ÷ diluted EPS
- Operating cash flow
- $182.94Breported
- Free cash flow
- $66.99Bcalculated: operating cash flow minus capital spending
- Total assets
- $758.38Breported, at year end
- Shareholders' equity
- $442.39Breported, at year end
- Return on equity
- 30.2%calculated: net income ÷ year-end equity
- Shares outstanding
- 7.43Bcover page of the latest filing, 23 Jul 2026
Latest filings
| Form | Filed | Period | Document |
|---|---|---|---|
| 8-K | 2 Sep 2026 | 2 Sep 2026 | Open on SEC.gov |
| 10-K | 29 Jul 2026 | 30 Jun 2026 | Open on SEC.gov |
| 8-K | 29 Jul 2026 | 29 Jul 2026 | Open on SEC.gov |
| 8-K | 5 Jun 2026 | 2 Jun 2026 | Open on SEC.gov |
| 8-K | 14 May 2026 | 13 May 2026 | Open on SEC.gov |
| 10-Q | 29 Apr 2026 | 31 Mar 2026 | Open on SEC.gov |
Key points
- Revenue rose 17.8% in fiscal 2026 and 67.4% over four years from fiscal 2022 (calculated).
- Two segments are about the same size: Productivity and Business Processes 42.2%, Intelligent Cloud 41.5%, More Personal Computing 16.3% of revenue (calculated) [2].
- Capital spending rose from $64.6 billion to $115.9 billion, so free cash flow fell to $67.0 billion even as profit rose (calculated).
- Dividends declared in fiscal 2026 were $0.91 a quarter, $3.64 for the year [5].
On this page
What does Microsoft actually sell?#
Microsoft reports its business in three segments: Productivity and Business Processes, Intelligent Cloud, and More Personal Computing [1]. The first holds Microsoft 365 for businesses and consumers, LinkedIn and Dynamics. The second holds server products and cloud services, including Azure and GitHub. The third holds Windows and devices, XBOX and search advertising [1].
The table shows revenue by segment in millions of dollars for fiscal 2026 and fiscal 2025 [2], with the growth rate we calculated.
| Segment | Fiscal 2026 | Fiscal 2025 | Growth |
|---|---|---|---|
| Productivity and Business Processes | $139,996 | $120,810 | 15.9% |
| Intelligent Cloud | $137,791 | $106,265 | 29.7% |
| More Personal Computing | $54,052 | $54,649 | -1.1% |
| Total revenue | $331,839 | $281,724 | 17.8% |
Revenue in millions of US dollars from the segment note of the fiscal 2026 Form 10-K [2]. Growth calculated.
Microsoft's chief operating decision maker uses operating income to allocate resources and judge each segment [2]. That makes segment operating income worth a look too: in fiscal 2026 it was $83,879 million for Productivity and Business Processes, $56,972 million for Intelligent Cloud and $14,386 million for More Personal Computing [2].
How have revenue and profit changed over five years?#
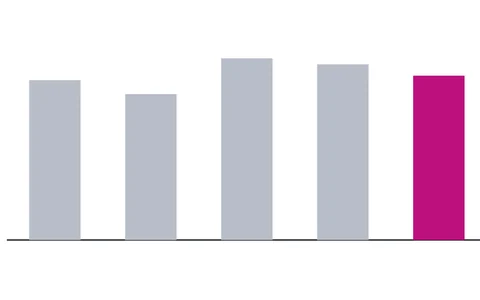
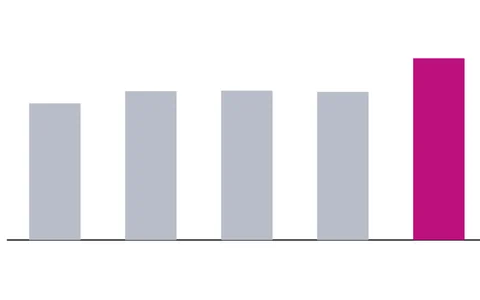
The chart above covers fiscal 2022 to fiscal 2026. Revenue went from $198.3 billion to $331.8 billion, up 67.4%, and net income from $72.7 billion to $133.7 billion, up 83.9% (calculated). Net income was nearly flat in fiscal 2023, then rose in each of the next three years (reported).
Why did free cash flow fall while profit rose?#
Operating cash flow rose from $136.2 billion in fiscal 2025 to $182.9 billion in fiscal 2026 (reported). But capital spending, the cash paid for property and equipment, rose 79.6%, from $64.6 billion to $115.9 billion (calculated). Free cash flow, which is typically calculated as operating cash flow minus capital expenditures and has no uniform definition [3], fell from $71.6 billion to $67.0 billion (calculated).
The 10-K says Microsoft has made and continues to make significant capital and operational investments to develop and support AI models and related cloud services, including building and expanding datacenters [1]. Its second risk factor says the cloud and AI strategy requires substantial investments and depends on customer demand, technology, competition and regulation [1].
What do EPS and dividends per share show?#
Earnings per share is net profit divided by the number of common shares [4]. Microsoft's diluted EPS was $17.95 in fiscal 2026, up 31.6% from $13.64 (calculated). The share count barely moved, so EPS tracked net income closely. Our EPS explainer shows the formula.
Microsoft declared four quarterly dividends of $0.91 per share in fiscal 2026, $3.64 in total, or $27,035 million [5]. Against diluted EPS that is a payout ratio of 20.3% (calculated).
What risks does Microsoft say could hurt results?#
- Competition. Microsoft says it faces intense competition across all markets, which could adversely affect its results [1].
- Cloud and AI spending. The strategy requires substantial investments and depends on customer demand and regulation [1].
- Security and privacy. A whole group of risk factors covers cybersecurity, data privacy and platform abuse [1].
Item 1A lists the risks the company itself calls most significant [6]. To turn the EPS above into a P/E ratio you need the current price from your broker; the P/E is price divided by earnings per share [7], and our P/E calculator does the division.
Frequently asked questions#
When does Microsoft's fiscal year end?
On June 30. Microsoft's fiscal 2026 ended June 30, 2026 [1], so its fiscal years do not match the calendar year.
What are Microsoft's three segments?
Productivity and Business Processes, Intelligent Cloud, and More Personal Computing [1]. Azure sits in Intelligent Cloud.
How much did Microsoft pay in dividends in fiscal 2026?
It declared $0.91 per share each quarter, $3.64 per share for the year, or $27,035 million in total [5].
Does high growth mean Microsoft stock will keep rising?
No. Past results do not predict future results or the share price. Any single stock can fall, including large ones, and this page makes no forecast.
The bottom line#
Microsoft's filings show two large segments of about the same size, fast growth in Intelligent Cloud, an operating margin of 46.8% and capital spending that rose 79.6% in one year (calculated). Profit and free cash flow moved in opposite directions in fiscal 2026, which is why reading the cash flow statement next to the income statement matters. Start with our guide to SEC filings: 10-K, 10-Q and 8-K, then open the 10-K from the list above.
Sources
- Microsoft Corporation Form 10-K for the fiscal year ended June 30, 2026.
- SEGMENT INFORMATION AND GEOGRAPHIC DATA (Microsoft Form 10-K, fiscal year ended June 30, 2026, R28).
- Non-GAAP Financial Measures (Compliance and Disclosure Interpretations).
- Earnings Per Share.
- Dividends Declared (Detail) (Microsoft Form 10-K, fiscal year ended June 30, 2026, R98).
- How to Read a 10-K/10-Q | Investor.gov.
- Price-earnings (P/E) Ratio.
Where the figures come from
- SEC EDGAR XBRL company facts for MICROSOFT CORP. U.S. Securities and Exchange Commission, downloaded 6 Oct 2026. Annual values from Form 10-K; when a later filing restates a year, we show the latest reported value. Each fiscal year is labelled by the calendar year in which it ends.
- SEC EDGAR filing index for MICROSOFT CORP. Form list, filing dates and fiscal year end.
- Net margin, payout ratio, free cash flow and return on equity are calculated by ChartWise from the reported figures above, using the formula shown under each number.
Education only. This page is not investment, tax or legal advice. Stocks can lose value. See our risk disclosure.