Glossary
Bull market
"Bull market" is one of the most used phrases in market news. It has a rough working definition, and it only ever describes what has already happened.
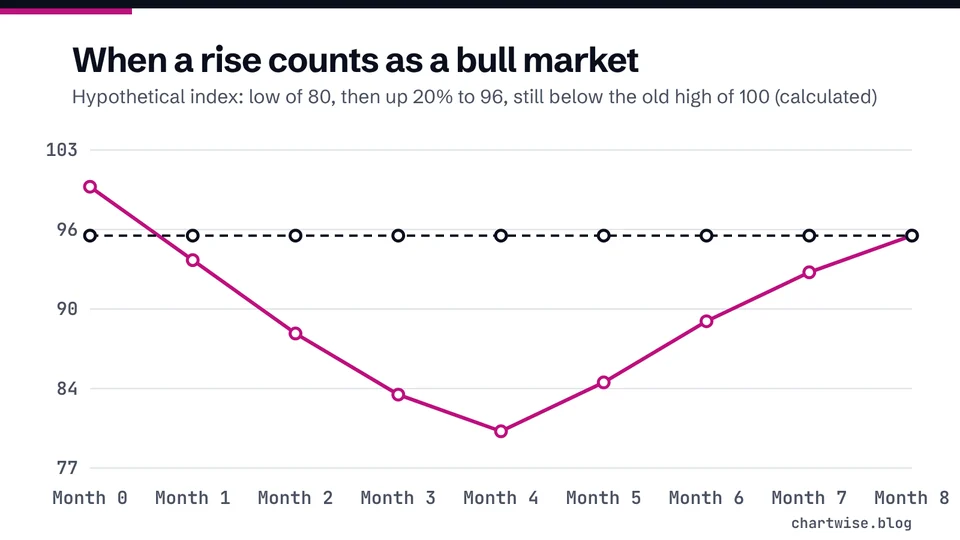
A bull market is a period when stock prices are rising and investors are optimistic. The SEC's investor site says it generally means a broad market index rising 20% or more over at least two months.
Quick answer
A bull market is a time when stock prices are rising and sentiment is optimistic. Generally it means a broad market index has risen 20% or more over at least a two-month period [1]. The label describes past moves and says nothing certain about what comes next.
Key points
- The SEC's Investor.gov uses a rough rule: a rise of 20% or more in a broad index over at least two months [1].
- The CFTC's glossary defines it more loosely, as prices generally rising over months or years [2].
- It is a label for the past; a bull market can turn into a correction or a bear market.
On this page
What does bull market mean?#
Investor.gov, the SEC's site for individual investors, defines a bull market as a time when stock prices are rising and market sentiment is optimistic. It adds a rough test: generally, a rise of 20% or more in a broad market index over at least a two-month period [1]. For how indexes are built, see what is a stock index.
Not every source uses a number. The CFTC's glossary calls it a market in which prices generally are rising over a period of months or years, the opposite of a bear market [2]. FINRA uses "bull market" for a large increase in prices [3]. The word "generally" matters: none of these sources names an official body that declares when a bull market starts.
| Source | How it describes a bull market |
|---|---|
| Investor.gov (SEC) | A broad index up 20% or more over at least two months |
| CFTC glossary | Prices generally rising over months or years |
| FINRA | A large increase in prices |
Wording paraphrased from Investor.gov [1], the CFTC [2] and FINRA [3].
What does a bull market look like in real numbers?#
The rebound after the 2020 fall shows how the rule of thumb is applied. The Federal Reserve Bank of St. Louis reports that the S&P 500 fell to 66% of its Feb. 19, 2020 peak by March 23, 2020, then reached 115% of that peak by Feb. 19, 2021 [4]. The post itself does not use the term bull market.
Does a bull market mean prices will keep rising?#
No. The label is applied after a rise has already happened, and the rule of thumb says nothing about how long it lasts. The SEC reminds investors that past performance cannot predict future performance [5], and that large company stocks as a group have lost money on average about one out of every three years [6]. To look at long stretches of price history yourself, start with how to read a stock chart.
Frequently asked questions#
Why is it called a bull market?
The CFTC's glossary defines a bull as one who expects a rise in prices, the opposite of a bear [2]. The sources we cite do not explain where the animal names came from.
Is there an official start date for a bull market?
No. Investor.gov describes the 20% test as what generally happens [1], and other glossaries give no number at all. Any start date you read is someone's own measurement, made after the fact.
Can a single stock be in a bull market?
The definitions we cite refer to a broad market index or to the market as a whole [1]. For one stock, it is clearer to state the actual percentage change and the dates.
The bottom line#
A bull market is a description of a broad, sustained rise, usually 20% or more in a broad index. Check where the rise is measured from, remember it can end without notice, and compare it with a bear market and a market correction. Read our risk disclosure for the bigger picture.
Sources
Education only. This page is not investment, tax or legal advice. Stocks can lose value. See our risk disclosure.