Glossary
Market correction
"The market is in correction territory" is a phrase you will meet in market news. It refers to a specific size of drop, and it is smaller than a bear market.
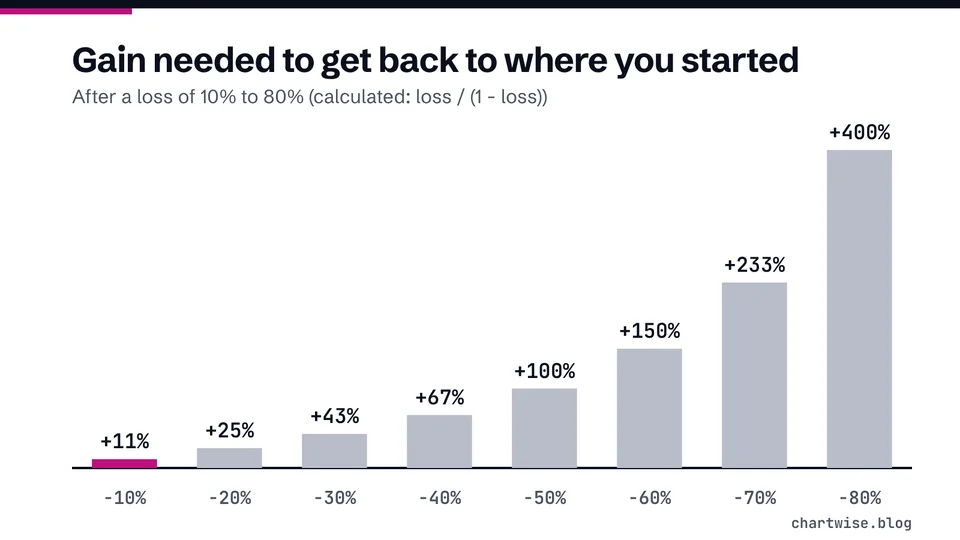
A market correction is a reversal of at least 10% in the price of stocks, bonds, commodities or an index before the earlier trend resumes. A deeper fall of 20% or more in a broad index is usually called a bear market.
Quick answer
A market correction is when stocks, bonds, commodities or an index reverse course by at least 10% before resuming their previous trend [1]. A drop of 20% or more in a broad index is generally called a bear market instead [2].
Key points
On this page
What is a market correction?#
FINRA defines a correction as when stocks, bonds, commodities or indices reverse course by at least 10 percent before resuming their previous upward or downward trend [1]. For a rising stock market, that means a fall of at least 10% from a recent high.
The word sits between ordinary ups and downs and a bear market, which Investor.gov generally describes as a broad index falling 20% or more over at least two months [2]. So a drop of 10% to just under 20% fits the correction definition without meeting the bear market rule of thumb.
| Drop from the recent high | Usual label |
|---|---|
| Less than 10% | A pullback or normal volatility |
| 10% to under 20% | A correction |
| 20% or more in a broad index | A bear market |
Thresholds from FINRA [1] and Investor.gov [2]. "Pullback" has no official definition in the sources we cite.
How do you tell whether a drop is a correction?#
Measure the fall from the most recent high, not from where you bought. Then remember that the definition has two parts: a reversal of at least 10%, and the previous trend resuming afterwards [1]. The second part is only visible later.
A real fall can pass through correction territory on its way to something larger. In 2020 the S&P 500 dropped to 66% of its Feb. 19 peak by March 23, according to the Federal Reserve Bank of St. Louis [3]: a 34% fall (calculated) that went well past the 10% line within weeks.
What should a beginner take from a correction?#
Mostly context. A correction label tells you how far prices have fallen, not where they go next; the SEC reminds investors that past performance cannot predict future performance [4]. It is also a good moment to recall that the SEC describes diversification as spreading money among different investments to reduce risk [5]. See diversification explained and stock market risk explained.
Frequently asked questions#
How is a correction different from a bear market?
Can a single stock have a correction?
Yes. FINRA's definition covers stocks as well as bonds, commodities and indices [1]. For one stock, a 10% move can be ordinary, so it helps to compare it with the stock's usual swings; see volatility.
Does a correction always turn into a bear market?
No. By FINRA's definition, a correction is a reversal that is followed by the previous trend resuming [1]. Some drops stop at 10% to 20%; others keep going. You cannot tell which while it is happening.
The bottom line#
A correction is a drop of at least 10% that later gives way to the earlier trend. Measure it from the recent high, keep the 20% bear market line in mind, and treat the label as a description, not a forecast. Compare it with a bull market and read our risk disclosure.
Sources
Education only. This page is not investment, tax or legal advice. Stocks can lose value. See our risk disclosure.