Company snapshot · AAPL
Apple (AAPL): what its filings show
Apple reported $416.2 billion of revenue and $112.0 billion of net income for fiscal 2025, which ended September 27, 2025. This page explains what those numbers mean and what Apple itself says could hurt them.
Quick answer
In fiscal 2025 Apple reported revenue of $416.2 billion, net income of $112.0 billion and diluted EPS of $7.46, as reported in its Form 10-K [1]. iPhone was about half of net sales and Services about a quarter (calculated).
No share price here on purpose. Prices change every second and we do not have a licensed live feed. Look up the current price with your broker, then use our P/E calculator with the EPS below.
Key figures, fiscal year 2025 (year ended 27 Sep 2025, Form 10-K filed 31 Oct 2025)
- Revenue
- $416.16Breported
- Net income
- $112.01Breported
- Net margin
- 26.9%calculated: net income ÷ revenue
- Diluted EPS
- $7.46reported
- Dividends per share
- $1.02reported, declared
- Payout ratio
- 13.7%calculated: dividends per share ÷ diluted EPS
- Operating cash flow
- $111.48Breported
- Free cash flow
- $98.77Bcalculated: operating cash flow minus capital spending
- Total assets
- $359.24Breported, at year end
- Shareholders' equity
- $73.73Breported, at year end
- Return on equity
- 151.9%calculated: net income ÷ year-end equity
- Shares outstanding
- 14.59Bcover page of the latest filing, 17 Jul 2026
Latest filings
| Form | Filed | Period | Document |
|---|---|---|---|
| 10-Q | 31 Jul 2026 | 27 Jun 2026 | Open on SEC.gov |
| 8-K | 30 Jul 2026 | 30 Jul 2026 | Open on SEC.gov |
| 10-Q | 1 May 2026 | 28 Mar 2026 | Open on SEC.gov |
| 8-K | 30 Apr 2026 | 30 Apr 2026 | Open on SEC.gov |
| 8-K | 20 Apr 2026 | 17 Apr 2026 | Open on SEC.gov |
| 8-K | 24 Feb 2026 | 24 Feb 2026 | Open on SEC.gov |
Key points
- iPhone brought in 50.4% of fiscal 2025 net sales and Services 26.2% (calculated from the 10-K table) [1].
- Revenue grew 13.8% from fiscal 2021 to fiscal 2025, while diluted EPS grew 33.0% (calculated).
- The diluted share count fell 11.0% over the same years (calculated), so each share's slice of profit grew faster than profit itself.
- Dividends declared were $1.02 per share in fiscal 2025, about 13.7% of diluted EPS (calculated).
- Apple's first listed risk is the economy: it says adverse conditions can materially hurt its business and stock price [1].
On this page
What does Apple actually sell?#
In its own words, Apple designs, manufactures and markets smartphones, personal computers, tablets, wearables and accessories, and sells a variety of related services [1].
Apple does not report its business by product line as segments. Its reportable segments are regions: the Americas, Europe, Greater China, Japan and Rest of Asia Pacific [1]. The product split comes from a separate net sales table in Item 7, shown below for fiscal 2025 and fiscal 2024, in millions of dollars [1].
| Category | Fiscal 2025 | Fiscal 2024 | Change |
|---|---|---|---|
| iPhone | $209,586 | $201,183 | 4% |
| Mac | $33,708 | $29,984 | 12% |
| iPad | $28,023 | $26,694 | 5% |
| Wearables, Home and Accessories | $35,686 | $37,005 | -4% |
| Services | $109,158 | $96,169 | 14% |
| Total net sales | $416,161 | $391,035 | 6% |
Net sales by category in millions of US dollars, as reported in Item 7 of the fiscal 2025 Form 10-K [1].
Two lines carry the business. iPhone was 50.4% of total net sales and Services 26.2% (calculated). Services also grew fastest of the five categories in fiscal 2025, at 14% [1]. That mix matters when you compare Apple with other companies in its sector: a phone maker with a large services business does not look like a pure hardware company.
How have revenue and profit changed over five years?#
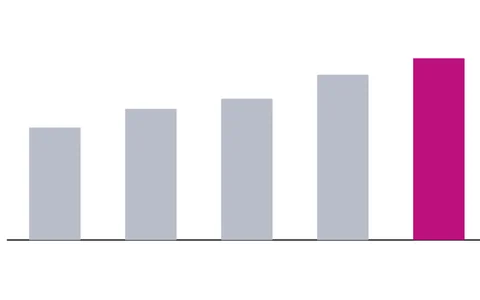
The chart above shows fiscal 2021 to fiscal 2025. Revenue went from $365.8 billion to $416.2 billion, a rise of 13.8% (calculated). Net income went from $94.7 billion to $112.0 billion, up 18.3% (calculated).
The path was not a straight line. Revenue dipped in fiscal 2023 to $383.3 billion and net income fell in both fiscal 2023 and fiscal 2024 before jumping 19.5% in fiscal 2025 (calculated). Item 7 of each 10-K, management's discussion and analysis, is where a company gives its own view of why results changed [2].
What do EPS and dividends per share show?#
Earnings per share is a company's net profit divided by the number of its common shares [3]. Apple's diluted EPS rose from $5.61 in fiscal 2021 to $7.46 in fiscal 2025, up 33.0% (calculated). That is faster than net income grew, because the weighted diluted share count fell from about 16.86 billion to 15.00 billion shares, down 11.0% (calculated). The 10-K also reports that on May 1, 2025 Apple announced an additional program to repurchase up to $100 billion of its stock [1]. Our EPS explainer covers how share counts change EPS.
A dividend is a portion of a company's profit paid to shareholders [4]. Apple declared $1.02 per share in fiscal 2025, up from $0.85 in fiscal 2021 (reported). Compared with EPS, that is a payout ratio of about 13.7% (calculated), so most of the profit was not paid out as dividends.
What risks does Apple say could hurt results?#
Item 1A of a 10-K lists the most significant risks that apply to the company [2]. Apple's first three risk factors, in its own order, are:
- The economy. Apple says adverse global and regional economic conditions can materially adversely affect its business, results, financial condition and stock price [1].
- Politics, trade and disruption. Political events, trade disputes, geopolitical tensions, conflict, natural disasters and other interruptions can affect the business [1].
- Competition. Apple's markets are highly competitive and subject to rapid technological change, and it says it may be unable to compete effectively [1].
These are the company's own warnings, not forecasts. They are the risks Apple chose to list first in the section reserved for its most significant risks. Our guide to stock market risk explains the wider risks of holding any single company.
How should a beginner use these numbers?#
- Check the period
Apple's fiscal year ends on the last Saturday of September [1], so fiscal 2025 ended September 27, 2025. The SEC data we downloaded on October 6, 2026 did not yet include a fiscal 2026 annual report.
- Add a live price yourself
The P/E ratio divides the current share price by earnings per share [5]. Take the price from your broker and the diluted EPS of $7.46 into our P/E calculator. Investor.gov's definition uses earnings for the past 12 months [5], and $7.46 covers the year that ended September 27, 2025, so the result is a P/E on fiscal 2025 earnings, not on the latest 12 months.
- Compare like with like
P/E is a way of judging whether a price is high or low compared with the past or with other companies [5]. Compare Apple with its own history or with similar companies, not with a bank or a soda maker.
- Read the filing
Open the 10-K from the filings list above. Read Item 1A for risks and Item 7 for management's explanation of the year [2].
Frequently asked questions#
When does Apple's fiscal year end?
On the last Saturday of September. Apple uses a 52- or 53-week year [1]. Fiscal 2025 ended September 27, 2025.
How much of Apple revenue comes from the iPhone?
In fiscal 2025 iPhone net sales were $209,586 million out of $416,161 million in total [1], or 50.4% (calculated).
Does Apple pay a dividend?
Yes. Apple declared $1.02 per share in dividends for fiscal 2025, as reported in its Form 10-K. A dividend is a portion of profit paid to shareholders and is not promised for the future [4].
Is Apple stock a good buy?
We do not say. This page only explains what Apple has reported. Whether any stock suits you depends on its price, your goals and your other holdings, and any single stock can lose value.
The bottom line#
Apple's filings show a company that earns about half its sales from one product, a growing share from Services, and a falling share count that has lifted EPS faster than profit. None of that says what the stock is worth today. Use the numbers to ask better questions, read Item 1A and Item 7 yourself, and see our guide to SEC filings: 10-K, 10-Q and 8-K for where each number lives.
Sources
Where the figures come from
- SEC EDGAR XBRL company facts for Apple Inc. U.S. Securities and Exchange Commission, downloaded 6 Oct 2026. Annual values from Form 10-K; when a later filing restates a year, we show the latest reported value. Each fiscal year is labelled by the calendar year in which it ends.
- SEC EDGAR filing index for Apple Inc. Form list, filing dates and fiscal year end.
- Net margin, payout ratio, free cash flow and return on equity are calculated by ChartWise from the reported figures above, using the formula shown under each number.
Education only. This page is not investment, tax or legal advice. Stocks can lose value. See our risk disclosure.