Calculator
P/E ratio calculator
Enter a share price and earnings per share for the last 12 months. The calculator returns the trailing P/E, the earnings yield and, if you add your own EPS forecast, a forward P/E.
Quick answer
P/E = share price / earnings per share for the past 12 months [1]. With the default inputs, a $50 share and $2.50 of EPS give a P/E of 20 and an earnings yield of 5% (calculated). P/E tells you how much investors pay for a dollar of earnings [2].
This calculator needs JavaScript. The formula and a worked example below show the same calculation by hand.
Key points
On this page
How does the P/E ratio calculator work?#
It applies the definition used by the SEC's Investor.gov: the current stock price divided by current earnings per share, where EPS is earnings for the past 12 months divided by common shares outstanding [1]. FINRA describes the result as how much investors are paying for a dollar of a company's earnings [2].
The calculator also shows the earnings yield, which is EPS divided by price. It is the same comparison read the other way: how many cents of yearly earnings stand behind each dollar of share price. S&P Dow Jones Indices uses an earnings to price ratio as one of its value factors when it sorts stocks into its value and growth style indices [3].
P/E = share price / EPS (last 12 months)
earnings yield = EPS / share price
If you type a forecast for the next 12 months, the calculator also divides the price by that number. Nasdaq's glossary calls this price to prospective earnings, using a consensus forecast [4]. Here the forecast is yours, so the forward P/E is only as good as your guess.
Can you check the result by hand?#
The P/E moves with both inputs. Keep EPS at $2.50 and change the price, and the ratio changes in step. The table uses hypothetical prices, not quotes.
| Hypothetical case | P/E | Earnings yield |
|---|---|---|
| Price $25, EPS $2.50 | 10 | 10% |
| Price $50, EPS $2.50 | 20 | 5% |
| Price $75, EPS $2.50 | 30 | 3.33% |
| Price $50, EPS $2.00 | 25 | 4% |
All values calculated with the same formula as the calculator.
Where do you find the EPS to enter?#
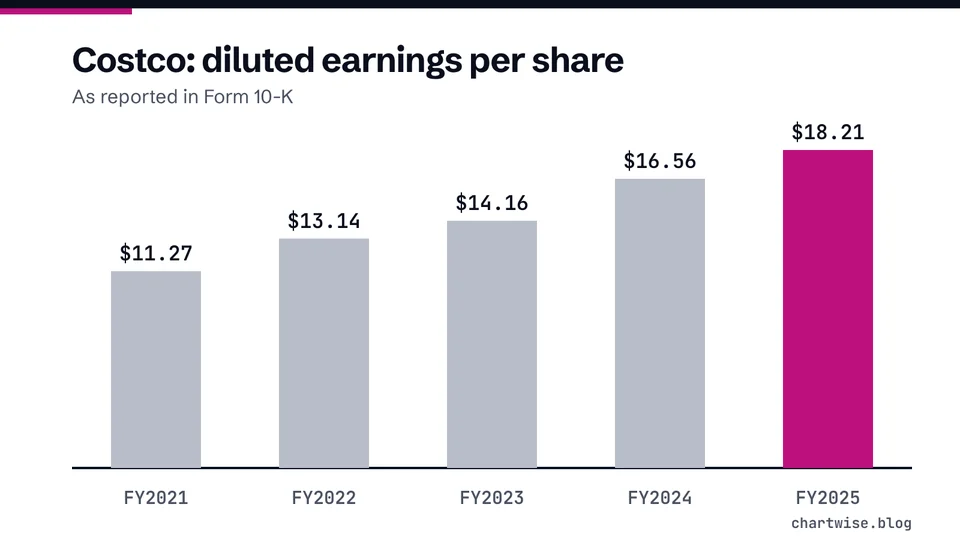
Earnings per share comes from the income statement in a company's annual report on Form 10-K or quarterly report on Form 10-Q. Basic EPS is net income divided by common shares outstanding [5]; diluted EPS adds shares that could be created from options, warrants and convertible securities [5]. For the last 12 months, use the annual figure if the fiscal year just ended; otherwise adding the EPS of the four most recent quarters gives an approximation, not an exact figure, because each quarter's EPS is based on that quarter's share count.
Example: Microsoft reported diluted EPS of $17.95 for its fiscal year ended June 30, 2026 [6]. That figure, plus a share price you look up yourself, is all the calculator needs. See net income and earnings per share explained for where these numbers come from.
What does the calculator not account for?#
- Losses. When EPS is negative, dividing the price by it gives a negative number that does not describe what you pay for earnings, so the calculator shows "not meaningful". With EPS of zero it cannot divide at all.
- Industry differences. Average ratios can vary significantly across industries, so compare a P/E with similar companies and the market as a whole [2].
- Why the price is low. A stock can look cheap on P/E because some investors see reduced prospects that are not yet in reported earnings [7].
- Adjusted earnings. Some companies publish non-GAAP EPS; the SEC requires them to show the GAAP figure and reconcile the two [8]. Use the same kind of EPS when you compare companies.
For the full explanation, with real filings, read the P/E ratio explained. For the balance-sheet side of valuation, see book value and the price-to-book ratio.
Frequently asked questions#
What is a good P/E ratio?
There is no single good number. The sources we cite give no threshold, and FINRA notes that average ratios vary significantly across industries [2]. Compare a company with its own history and with similar companies.
What is the difference between trailing and forward P/E?
Trailing P/E uses earnings for the most recent 12 months; forward (prospective) P/E uses forecast earnings for the next 12 months [4]. Forecasts can be wrong, so the forward figure is less certain.
Why does the calculator show an earnings yield?
Because it is the same ratio upside down, shown as a percentage. A P/E of 20 is an earnings yield of 5% (calculated). It is not a dividend and not a return you will receive.
Does a low P/E mean the stock is undervalued?
Not by itself. FINRA warns that not every stock with a low P/E represents true value [7]. Earnings may be about to fall, or the market may be pricing in risks the last 12 months do not show.
The bottom line#
Use the calculator to turn a price and an EPS figure into a ratio you can compare, not into a verdict. Check which EPS you used, compare within the same industry, and read the reasons behind a low or high number. For the bottom line that feeds EPS, start with net income.
Sources
- Price-earnings (P/E) Ratio.
- Evaluating Stocks.
- S&P U.S. Style Indices Methodology.
- Trailing Earnings.
- Financial Performance Metrics Every Investor Should Know.
- EARNINGS PER SHARE (Microsoft Corporation Form 10-K for the fiscal year ended June 30, 2026, R12).
- Value Investing.
- 17 CFR Part 244 Regulation G.
Education only. This page is not investment, tax or legal advice. Stocks can lose value. See our risk disclosure.