Company snapshot · JNJ
Johnson & Johnson (JNJ): what its filings show
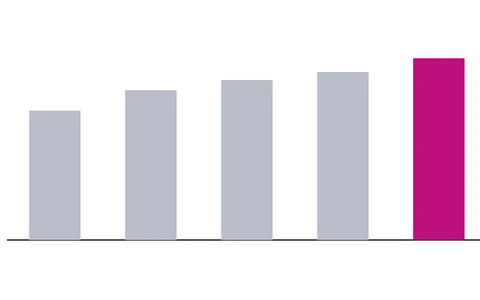
Johnson & Johnson reported $94.2 billion of sales and $26.8 billion of net income for fiscal 2025, which ended December 28, 2025. Its profit line swings far more than its sales, and this page shows why that matters when you read the chart.
Quick answer
For fiscal 2025, ended December 28, 2025, Johnson & Johnson reported sales of $94.2 billion [2], net income of $26.8 billion and diluted EPS of $11.03. Innovative Medicine made 64.1% of sales and MedTech 35.9% (calculated).
No share price here on purpose. Prices change every second and we do not have a licensed live feed. Look up the current price with your broker, then use our P/E calculator with the EPS below.
Key figures, fiscal year 2025 (year ended 28 Dec 2025, Form 10-K filed 11 Feb 2026)
- Revenue
- $94.19Breported
- Net income
- $26.80Breported
- Net margin
- 28.5%calculated: net income ÷ revenue
- Diluted EPS
- $11.03reported
- Dividends per share
- $5.14reported, cash paid
- Payout ratio
- 46.6%calculated: dividends per share ÷ diluted EPS
- Operating cash flow
- $24.53Breported
- Free cash flow
- $19.70Bcalculated: operating cash flow minus capital spending
- Total assets
- $199.21Breported, at year end
- Shareholders' equity
- $81.54Breported, at year end
- Return on equity
- 32.9%calculated: net income ÷ year-end equity
- Shares outstanding
- 2.41Bcover page of the latest filing, 17 Jul 2026
Latest filings
| Form | Filed | Period | Document |
|---|---|---|---|
| 8-K | 4 Aug 2026 | 4 Aug 2026 | Open on SEC.gov |
| 8-K | 29 Jul 2026 | 29 Jul 2026 | Open on SEC.gov |
| 8-K | 28 Jul 2026 | 27 Jul 2026 | Open on SEC.gov |
| 10-Q | 23 Jul 2026 | 28 Jun 2026 | Open on SEC.gov |
| 8-K | 15 Jul 2026 | 15 Jul 2026 | Open on SEC.gov |
| 10-Q | 22 Apr 2026 | 29 Mar 2026 | Open on SEC.gov |
Key points
- Sales grew 6.0% in fiscal 2025, with both segments up about 6% (calculated) [2].
- Fiscal 2023 net income includes $21,827 million from discontinued operations, mostly a $20,984 million gain on separating Kenvue [3].
- Without that, fiscal 2023 net income would have been about $13.3 billion (calculated), so most of the tall 2023 bar comes from the Kenvue separation, not from sales.
- Dividends declared were $5.14 per share in fiscal 2025, 46.6% of diluted EPS (calculated).
- The 10-K says the company faces numerous lawsuits over talc body powders [1].
On this page
What does Johnson & Johnson actually sell?#
The company says it is organized into two business segments: Innovative Medicine and MedTech [1]. The table gives worldwide sales by segment in millions of dollars [2], with growth we calculated.
| Segment | Fiscal 2025 | Fiscal 2024 | Fiscal 2023 | Growth 2025 |
|---|---|---|---|---|
| Innovative Medicine | $60,401 | $56,964 | $54,759 | 6.0% |
| MedTech | $33,792 | $31,857 | $30,400 | 6.1% |
| Total worldwide sales | $94,193 | $88,821 | $85,159 | 6.0% |
Sales in millions of US dollars from the segment note of the fiscal 2025 Form 10-K [2]. Growth calculated.
From fiscal 2023 to fiscal 2025, total sales rose 10.6% (calculated) [2]. Innovative Medicine alone was 64.1% of fiscal 2025 sales (calculated).
Why does net income jump around so much?#
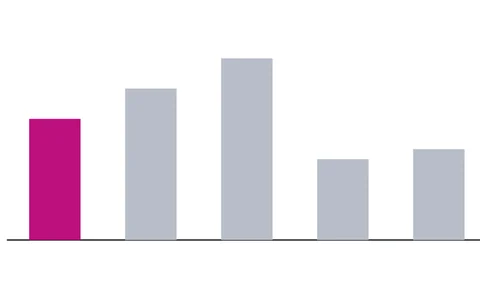
Look at the net income chart above and you will see a tall bar for the year that ended December 31, 2023: $35.2 billion, against $14.1 billion the next year (reported). Sales did not move like that.
The reason is in the 10-K's note on the Kenvue separation. For fiscal 2023 it reports net earnings from discontinued operations of $21,827 million, including a $20,984 million gain on the separation of Kenvue [3]. Taking the discontinued operations out leaves about $13.3 billion for that year (calculated).
Fiscal 2024 and fiscal 2025 also differ a lot: net income rose 90.6% while sales rose 6.0% (calculated). When profit and sales disagree like this, Item 7, management's discussion and analysis, is where the company explains the year [4].
Why does the chart show two FY2023 bars?#
Johnson & Johnson's fiscal years end close to December 31, sometimes just after it. In the SEC data, one fiscal year ended January 1, 2023 and the next ended December 31, 2023 (reported). Our charts label each year by the calendar year in which it ends, so both appear as FY2023. In the same way, the FY2022 bar is the year that ended January 2, 2022. Read the end dates in the filings list, and see our fiscal year entry for why companies use years that do not match the calendar.
What do EPS and dividends per share show?#
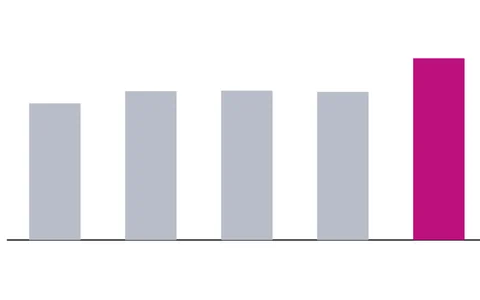
Earnings per share is net profit divided by the number of common shares [5], so it swings with net income. Diluted EPS was $13.72 for the year ended December 31, 2023, $5.79 for fiscal 2024 and $11.03 for fiscal 2025 (reported). Our EPS explainer shows how to read it.
Dividends moved much more smoothly. Dividends declared rose from $4.70 to $4.91 to $5.14 per share over the same three years (reported). The payout ratio was 84.8% in fiscal 2024 and 46.6% in fiscal 2025 (calculated), which shows how a ratio built on a jumpy EPS can mislead. A dividend is a portion of profit paid to shareholders [6], and no dividend is promised.
What risks does Johnson & Johnson say could hurt results?#
- Competition. Competitive pressures in its product markets could adversely affect earnings [1].
- Manufacturing. Interruptions and delays in manufacturing could hurt the business, sales and reputation [1].
- Suppliers. The company relies on third parties to make and supply certain products [1].
- Talc litigation. It is a defendant in numerous lawsuits over body powders containing talc, primarily JOHNSON'S Baby Powder [1].
The 10-K is the place to read how the company describes the litigation. To compare the company with its own history using a P/E ratio, take the current price from your broker; P/E is price divided by earnings per share [7], and our P/E calculator does the maths. Investor.gov's definition uses earnings for the past 12 months [7], and the $11.03 here covers fiscal 2025, which ended December 28, 2025, not the latest 12 months. A gain like the 2023 Kenvue gain raises EPS for that year, and a higher EPS makes the P/E lower for the same price.
Frequently asked questions#
What are Johnson & Johnson's two segments?
Why was Johnson & Johnson net income so high in 2023?
Fiscal 2023 included $21,827 million of net earnings from discontinued operations, including a $20,984 million gain on the separation of Kenvue [3].
When does the Johnson & Johnson fiscal year end?
Close to December 31. Fiscal 2025 ended December 28, 2025 [1].
Should I buy JNJ for its dividend?
We do not make recommendations. A dividend history is not a promise, and any single stock can lose value. Compare the numbers here with your own goals and other holdings.
The bottom line#
Johnson & Johnson's filings show steady sales growth in both segments, a profit line distorted by the 2023 Kenvue separation, a rising dividend and numerous talc lawsuits. The main lesson for a beginner is to check what is inside net income before trusting EPS or a P/E ratio. Our guide to how to read an income statement shows where discontinued operations appear.
Sources
- Johnson & Johnson Form 10-K for the fiscal year ended December 28, 2025.
- Segments of Business and Geographic Areas - Sales by Segment of Business (Johnson & Johnson Form 10-K for fiscal 2025, R109).
- Kenvue separation and discontinued operations (Johnson & Johnson Form 10-K for fiscal 2025, R31).
- How to Read a 10-K/10-Q | Investor.gov.
- Earnings Per Share.
- Dividend.
- Price-earnings (P/E) Ratio.
Where the figures come from
- SEC EDGAR XBRL company facts for JOHNSON & JOHNSON. U.S. Securities and Exchange Commission, downloaded 6 Oct 2026. Annual values from Form 10-K; when a later filing restates a year, we show the latest reported value. Each fiscal year is labelled by the calendar year in which it ends.
- SEC EDGAR filing index for JOHNSON & JOHNSON. Form list, filing dates and fiscal year end.
- Net margin, payout ratio, free cash flow and return on equity are calculated by ChartWise from the reported figures above, using the formula shown under each number.
Education only. This page is not investment, tax or legal advice. Stocks can lose value. See our risk disclosure.