Explainer · Company Fundamentals
Return on equity and profit margins explained
Profit margins tell you how much of each sales dollar a company keeps. Return on equity tells you how much profit it makes on the money that belongs to shareholders. Read together, they show how a company earns, not just how much.
Quick answer
Return on equity (ROE) is net income divided by common shareholders' equity, shown as a percentage [3]. Profit margin is net income divided by revenue for the same 12 months [2]; operating margin uses EBIT (earnings before interest and taxes) instead [3]. Compare both within one industry.
Key points
- Net profit margin = net income / revenue; operating margin = earnings before interest and taxes / revenue [2] [3].
- ROE = net income / shareholders' equity; FINRA's example: $15 million on $100 million of equity is 15% [3].
- ROE can be split into return on assets times financial leverage, so debt can lift ROE without a better business [4].
- Falling interest and tax costs can widen net margins on their own; a 2022 Federal Reserve staff note found they accounted for one-third of profit growth at S&P 500 nonfinancial firms over the prior two decades [6].
- Average ratios differ a lot by industry, so compare like with like [5].
On this page
What are profit margins?#
A margin is a slice of the income statement divided by revenue. Each line further down the statement gives a smaller slice, because more costs have been taken out. The SEC's small-business guide subtracts in this order: revenue minus cost of goods sold gives gross profit; minus operating expenses gives operating profit; minus interest and income tax gives net income [1].
The ratio names follow those lines. Nasdaq defines profit margin, also called net profit margin, as net income divided by revenue for the same 12-month period, shown as a percentage [2]. FINRA defines operating margin as EBIT (earnings before interest and taxes) divided by total revenue, and says it shows how much income each dollar of sales generates [3]. Gross margin applies the same division to gross profit. Start with revenue and net income if those terms are new.
- Gross margin
Gross profit / revenue. What is left after the direct cost of the goods or services sold.
- Operating margin
Operating earnings (EBIT) / revenue. What is left after running the business as well [3].
- Net profit margin
Net income / revenue. What is left after interest and income tax too [2].
- Revenue
- $835,000SEC example [1]
- Gross margin
- 70.06%$585,000 / $835,000, calculated
- Operating margin
- 44.91%$375,000 / $835,000, calculated
- Net profit margin
- 34.85%$291,000 / $835,000, calculated
What is return on equity?#
Return on equity measures profit against the money that belongs to shareholders. FINRA calls it a profitability measure determined by dividing net income by common shareholder equity, and gives an example: net income of $15 million and shareholder equity of $100 million make an ROE of 15 percent [3]. Nasdaq's definition specifies net income for the past 12 months [4].
Shareholders' equity is the same number as book value: total assets minus total liabilities. Our explainer on book value and the price-to-book ratio shows where to find it on the balance sheet. Equity changes during the year, so some people divide by the average of the opening and closing figures. The calculations below use year-end equity and say so.
How do real companies compare?#
The table uses figures as reported in each company's Form 10-K for its latest fiscal year in our data: revenue, operating income, net income and year-end stockholders' equity. Operating income stands in for EBIT here, which is close but not always identical.
| Company and fiscal year | Operating margin | Net margin | ROE (year-end equity) |
|---|---|---|---|
| Costco, fiscal 2025 | 3.77% | 2.94% | 27.77% |
| Coca-Cola, fiscal 2025 | 28.71% | 27.34% | 40.74% |
| Microsoft, fiscal 2026 | 46.78% | 40.31% | 30.23% |
| Apple, fiscal 2025 | 31.97% | 26.92% | 151.91% |
Ratios calculated from revenue, operating income, net income and stockholders' equity in each Form 10-K (SEC XBRL data). Fiscal years end Aug 31, 2025 (Costco), Dec 31, 2025 (Coca-Cola), Jun 30, 2026 (Microsoft) and Sep 27, 2025 (Apple).
Costco keeps under 3 cents of each sales dollar as net income, yet its ROE of 27.77% is not far below Microsoft's 30.23% (calculated). A thin margin earned on a very large revenue base, with a modest equity base, can still produce a solid ROE. FINRA tells investors to compare ratios with the company's own industry, since average ratios vary significantly across industries [5]. See the Costco and Microsoft pages for the filings.
Why can ROE be very high?#
Nasdaq's glossary notes that ROE may be decomposed into return on assets multiplied by financial leverage, where leverage is total assets divided by total equity [4]. A company can raise its ROE by earning more on its assets, or by funding the same assets with less equity.
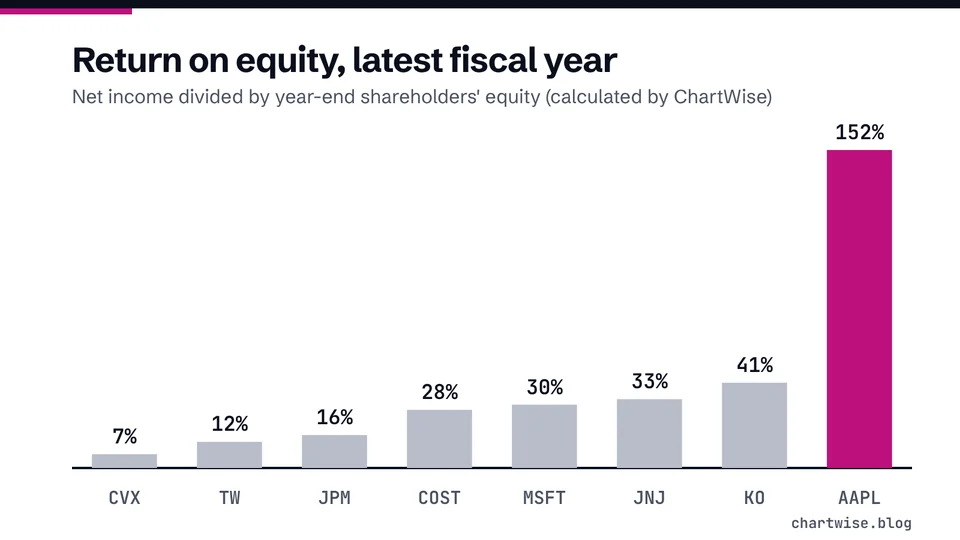
Apple shows the second effect. In fiscal 2025 its net income was 31.18% of total assets, and its assets were 4.87 times its equity; multiplied together that gives an ROE of 151.91% (all calculated from its Form 10-K). Microsoft's return on assets was 17.64% with leverage of 1.71, for an ROE of 30.23% (calculated). Apple's ROE is about five times Microsoft's (calculated) mostly because of the balance sheet, not because its margins are five times wider: its net margin was lower (calculated, see the table above). See the Apple page for the filing.
Why do operating and net margins differ?#
Between operating earnings and net income sit interest and income tax [1]. Changes in those two lines move net margin even when the business itself has not changed. A 2022 Federal Reserve staff note, which presents its author's own views, found that, for S&P 500 nonfinancial companies, interest and tax expenses fell from around 45 percent of EBIT before the Global Financial Crisis to 26 percent in the first quarter of 2022, and that this decline was responsible for a full one-third of their profit growth over the prior two-decade period [6].
For one company, a net margin that widens while the operating margin stays flat points to lower interest or tax costs, or to other income below the operating line. Read the income statement from the top to see which.
Mistakes beginners make with ROE and margins#
- Comparing across industries
A warehouse retailer and a software company keep very different shares of each sale. Average ratios vary significantly across industries [5].
- Praising a high ROE without checking leverage
ROE equals return on assets times assets over equity [4]. More debt and less equity lift ROE without any improvement in the business.
- Mixing periods
Net income for 12 months over revenue for the same 12 months [2]. Do not divide a quarter's profit by a year's revenue.
- Reading net margin as operating strength
Lower interest and taxes can widen net margins on their own [6]. Check the operating margin too.
- Ignoring negative equity
When equity is below zero, ROE is not meaningful. Look at the balance sheet before quoting the ratio.
Frequently asked questions#
What is a good return on equity?
Is profit margin the same as net margin?
Yes. Nasdaq treats profit margin and net profit margin as the same ratio: net income divided by revenue for the same 12-month period [2].
What is the difference between ROE and ROA?
ROE divides net income by shareholders' equity; return on assets divides it by total assets. ROE equals ROA multiplied by total assets over total equity [4], so the gap between them shows how much of the company is funded by liabilities.
Where do I find the numbers?
Revenue, operating income and net income are on the income statement; total assets, liabilities and equity are on the balance sheet. Both are in the company's 10-K and 10-Q, which are free on the SEC's EDGAR website [7].
The bottom line#
Margins show how much of each sale a company keeps; ROE shows how much it earns on shareholders' money. Calculate them from the same period, compare them only with similar companies, and always ask how much of a high ROE comes from leverage. Pair them with valuation measures such as the P/E ratio calculator and price-to-book before forming a view, and remember that strong past ratios do not protect a stock from falling.
Sources
Education only. This page is not investment, tax or legal advice. Stocks can lose value. See our risk disclosure.