Company snapshot · COST
Costco (COST): what its filings show
Costco sells goods in membership warehouses and also charges an annual fee to shop there. This page reads its fiscal 2025 Form 10-K in plain English, with no share price, rating or opinion on the stock.
Quick answer
In fiscal 2025, which ended August 31, 2025, Costco reported net sales of $269,912 million and membership fees of $5,323 million [1]. Net income was $8,099 million, a net margin of 2.94% (calculated). Membership fees equalled 65.72% of net income (calculated).
No share price here on purpose. Prices change every second and we do not have a licensed live feed. Look up the current price with your broker, then use our P/E calculator with the EPS below.
Key figures, fiscal year 2025 (year ended 31 Aug 2025, Form 10-K filed 8 Oct 2025)
- Revenue
- $275.24Breported
- Net income
- $8.10Breported
- Net margin
- 2.9%calculated: net income ÷ revenue
- Diluted EPS
- $18.21reported
- Dividends per share
- $4.92reported, declared
- Payout ratio
- 27.0%calculated: dividends per share ÷ diluted EPS
- Operating cash flow
- $13.34Breported
- Free cash flow
- $7.84Bcalculated: operating cash flow minus capital spending
- Total assets
- $77.10Breported, at year end
- Shareholders' equity
- $29.16Breported, at year end
- Return on equity
- 27.8%calculated: net income ÷ year-end equity
- Shares outstanding
- 443.48Mcover page of the latest filing, 27 May 2026
Latest filings
| Form | Filed | Period | Document |
|---|---|---|---|
| 8-K | 24 Sep 2026 | 24 Sep 2026 | Open on SEC.gov |
| 8-K | 8 Jul 2026 | 7 Jul 2026 | Open on SEC.gov |
| 10-Q | 3 Jun 2026 | 10 May 2026 | Open on SEC.gov |
| 8-K | 28 May 2026 | 28 May 2026 | Open on SEC.gov |
| 8-K | 15 Apr 2026 | 15 Apr 2026 | Open on SEC.gov |
| 10-Q | 11 Mar 2026 | 15 Feb 2026 | Open on SEC.gov |
Key points
- Costco operated 914 membership warehouses worldwide at August 31, 2025 [1].
- Revenue has two parts: net sales ($269,912 million) and membership fees ($5,323 million) in fiscal 2025 [1].
- Net margin was 2.94% in fiscal 2025 (calculated); the company says it operates profitably at significantly lower gross margins than most other retailers [1].
- Diluted EPS rose from $11.27 in fiscal 2021 to $18.21 in fiscal 2025, up 61.58% (calculated from the SEC data shown above).
- Fiscal 2024 dividends included a $15 per share special dividend, so that year's payout ratio was over 100% (calculated) [1].
On this page
What does Costco actually sell?#
Costco began operations in 1983 in Seattle. It is "principally engaged in the operation of membership warehouses" in the U.S. and Puerto Rico, Canada, Mexico, Japan, the U.K., Korea, Australia, Taiwan, China, Spain, France, Sweden, Iceland and New Zealand [1]. It operated 914 warehouses at August 31, 2025, up from 890 a year earlier and 861 two years earlier [1].
Shoppers pay an annual fee. The 10-K gives the annual fee as $65 in the U.S., varying in other countries, and says U.S. paid members can upgrade to an Executive membership for an additional $65 a year [1]. At the end of fiscal 2025 it had 81.0 million paid members and 145.2 million cardholders, counting the free household cards included with each paid membership [1].
How do net sales and membership fees add up?#
Costco's total revenue is net sales plus membership fees. The 10-K reports that net sales increased 8% to $269,912 million and membership fee revenue increased 10% to $5,323 million in fiscal 2025 [1]. The two add up to $275,235 million (calculated), the revenue figure in the panel above.
| Fiscal 2025 line | $ millions | Share of revenue |
|---|---|---|
| Net sales | 269,912 | 98.07% |
| Membership fees | 5,323 | 1.93% |
| Total revenue | 275,235 | 100% |
| Operating income | 10,383 | 3.77% |
| Net income | 8,099 | 2.94% |
Net sales and membership fees from the fiscal 2025 Form 10-K [1]; operating and net income from the SEC data above; shares calculated.
The 10-K also reports how many members renew: Costco reported a renewal rate of 92.3% in the U.S. and Canada and 89.8% worldwide at the end of fiscal 2025 [1].
How have revenue and profit changed over five years?#
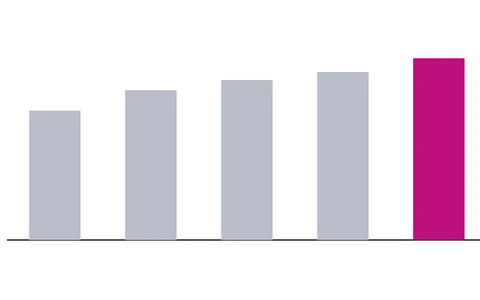
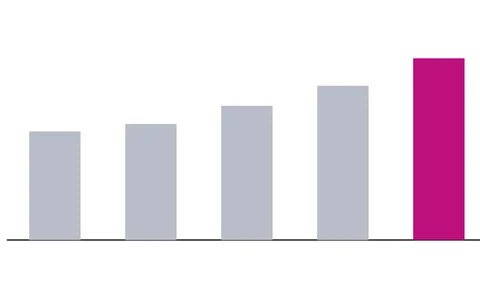
The bars above cover fiscal 2021 to fiscal 2025. Revenue rose from $195,929 million to $275,235 million, up 40.48% (calculated). Net income rose from $5,007 million to $8,099 million, up 61.75% (calculated), so profit grew faster than sales and the net margin widened from 2.56% to 2.94% (calculated).
Diluted EPS went from $11.27 to $18.21, up 61.58% (calculated), almost the same as net income because the diluted share count barely changed: 444.3 million in fiscal 2021 and 444.8 million in fiscal 2025 in the SEC data. Diluted EPS divides net income by common shares plus shares that could be created from options and similar instruments [2]. See earnings per share explained.
What happened to dividends in fiscal 2024?#
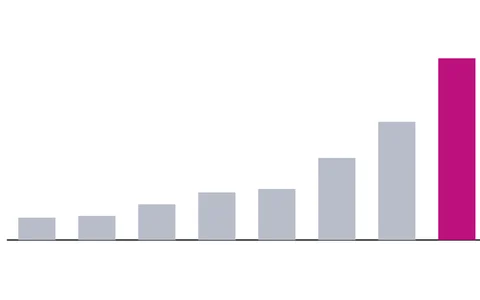
The dividends chart above jumps in fiscal 2024 and falls back in fiscal 2025. The 10-K explains why: dividends in fiscal 2024 included a special dividend of $15 per share [1]. Without it, dividends declared that year would have been $19.36 minus $15 = $4.36 per share (calculated).
In fiscal 2025 Costco declared $4.92 per share, $2,183 million in total, and the board raised the quarterly dividend from $1.16 to $1.30 per share [1]. The company also repurchased 943,000 shares in fiscal 2025 and 1,004,000 in fiscal 2024 [1].
- Fiscal 2024, as declared
- 116.91%$19.36 / $16.56 diluted EPS, calculated
- Fiscal 2024, without the $15 special
- 26.33%$4.36 / $16.56, calculated
- Fiscal 2025
- 27.02%$4.92 / $18.21, calculated
The payout ratio is the dividend divided by earnings for the same period [3]. A one-off special dividend can push it over 100% for one year, so check whether a jump is special before reading it as a trend. Our SEC data has no dividends-per-share value for fiscal 2021 and fiscal 2022, so those bars are blank; the 10-K for those years is the place to check. See how the payout ratio works.
What risks does Costco say could hurt results?#
Item 1A of a 10-K covers the most significant risks that apply to the company [4]. Costco's list opens with these two, quoted from the fiscal 2025 filing [1]:
- "We are highly dependent on the financial performance of our U.S. and Canadian operations."
- "We may be unsuccessful implementing our growth strategy, including expanding our business in existing markets and new markets, and integrating acquisitions"
These are the company's own words, not a forecast. A thin margin also makes profit sensitive in simple arithmetic: for a hypothetical cost increase equal to 1% of fiscal 2025 revenue, the extra cost would be $2,752.35 million, or 33.98% of that year's net income (calculated).
How should a beginner use these numbers?#
- Separate fees from sales
Track membership fees and the renewal rate next to net sales. They are reported separately in the 10-K.
- Check for one-off items
The fiscal 2024 dividend included a $15 special. Look for similar one-offs before comparing years.
- Bring your own price
This page has no share price. Take the current price from your broker and divide by diluted EPS with our P/E calculator. Investor.gov's definition uses earnings for the past 12 months [5], and the $18.21 covers fiscal 2025, which ended August 31, 2025, not the latest 12 months.
- Compare with other retailers
Compare Costco with other retailers using their own 10-K filings, which are public on the SEC's EDGAR website [4], rather than with a bank or a software company.
Frequently asked questions#
How much revenue does Costco make from membership fees?
$5,323 million in fiscal 2025, up 10%, compared with net sales of $269,912 million [1]. That is 1.93% of total revenue (calculated).
Why was Costco's dividend so high in fiscal 2024?
Because fiscal 2024 dividends included a special dividend of $15 per share [1]. Dividends declared that year were $19.36 per share in the SEC data, or $4.36 without the special (calculated).
When does Costco's fiscal year end?
Around the end of August or start of September. Fiscal 2025 ended August 31, 2025 and fiscal 2024 ended September 1, 2024 [1].
Does this page say whether Costco stock is a buy?
No. It explains what the company reported and makes no recommendation. Stocks can lose value, and past growth does not predict future results.
The bottom line#
Costco's filings show a retailer with a net margin under 3% whose revenue rose 40.48% and diluted EPS 61.58% from fiscal 2021 to fiscal 2025 (calculated from the SEC data above). Membership fees are a small share of revenue but large next to profit, and the fiscal 2024 dividend was lifted by a one-off special. Read each year with those facts in mind.
Sources
Where the figures come from
- SEC EDGAR XBRL company facts for COSTCO WHOLESALE CORP /NEW. U.S. Securities and Exchange Commission, downloaded 6 Oct 2026. Annual values from Form 10-K; when a later filing restates a year, we show the latest reported value. Each fiscal year is labelled by the calendar year in which it ends.
- SEC EDGAR filing index for COSTCO WHOLESALE CORP /NEW. Form list, filing dates and fiscal year end.
- Net margin, payout ratio, free cash flow and return on equity are calculated by ChartWise from the reported figures above, using the formula shown under each number.
Education only. This page is not investment, tax or legal advice. Stocks can lose value. See our risk disclosure.