Company snapshot · TW
Tradeweb (TW): what its filings show
Tradeweb runs electronic marketplaces for trading rates, credit, equities and money markets products. This page reads its 2025 Form 10-K in plain English, with no share price, rating or opinion on the stock.
Quick answer
Tradeweb reported 2025 revenue of $2,052,429 thousand (about $2.05 billion) and net income attributable to the company of $812,792 thousand [2]. Transaction fees and commissions made up 82.85% of revenue (calculated). The company lists market conditions and trading volumes among the factors that could change its results [1].
No share price here on purpose. Prices change every second and we do not have a licensed live feed. Look up the current price with your broker, then use our P/E calculator with the EPS below.
Key figures, fiscal year 2025 (year ended 31 Dec 2025, Form 10-K filed 5 Feb 2026)
- Revenue
- $2.05Breported
- Net income
- $812.79Mreported
- Net margin
- 39.6%calculated: net income ÷ revenue
- Diluted EPS
- $3.78reported
- Dividends per share
- $0.48reported, declared
- Payout ratio
- 12.7%calculated: dividends per share ÷ diluted EPS
- Operating cash flow
- $1.17Breported
- Free cash flow
- $1.13Bcalculated: operating cash flow minus capital spending
- Total assets
- $8.19Breported, at year end
- Shareholders' equity
- $6.51Breported, at year end
- Return on equity
- 12.5%calculated: net income ÷ year-end equity
Latest filings
| Form | Filed | Period | Document |
|---|---|---|---|
| 10-Q | 30 Jul 2026 | 30 Jun 2026 | Open on SEC.gov |
| 8-K | 30 Jul 2026 | 30 Jul 2026 | Open on SEC.gov |
| 8-K | 20 May 2026 | 19 May 2026 | Open on SEC.gov |
| 10-Q | 29 Apr 2026 | 31 Mar 2026 | Open on SEC.gov |
| 8-K | 29 Apr 2026 | 29 Apr 2026 | Open on SEC.gov |
| DEF 14A | 26 Mar 2026 | 19 May 2026 | Open on SEC.gov |
Key points
- Tradeweb operates electronic marketplaces in rates, credit, equities and money markets for more than 3,000 clients [1].
- Transaction fees and commissions were $1,700,427 thousand of 2025 revenue; subscription fees were $234,017 thousand [2].
- Revenue rose 90.67% and diluted EPS rose 246.79% from fiscal 2021 to fiscal 2025 (calculated from the SEC data shown above).
- The company names changes in market conditions and their effect on trading volumes as a factor that could change its results [1].
- London Stock Exchange Group (LSEG) controls Tradeweb, which the filing calls a controlled company [1].
On this page
What does Tradeweb actually sell?#
Tradeweb describes itself as "a leader in building and operating electronic marketplaces" for clients across the financial system [1]. Its marketplaces cover four asset classes: rates, credit, equities and money markets [1].
It serves four client sectors: institutional, wholesale, retail and corporates [1]. The 10-K says its network has more than 3,000 clients in over 85 countries [1]. On the retail side, it gives financial advisors access to small "micro-lot" bond trades through its regulated retail alternative trading system [1].
Where does Tradeweb's revenue come from?#
The income statement splits revenue into four lines. Amounts below are in thousands of dollars, as the 10-K reports them [2]:
| Revenue line, $ thousands | FY2025 | FY2024 | FY2023 |
|---|---|---|---|
| Transaction fees and commissions | 1,700,427 | 1,423,547 | 1,078,344 |
| Subscription fees | 234,017 | 206,659 | 183,972 |
| LSEG market data fees | 93,197 | 82,145 | 64,336 |
| Other | 24,788 | 13,598 | 11,567 |
| Total revenue | 2,052,429 | 1,725,949 | 1,338,219 |
Consolidated statements of income, 2025 Form 10-K [2].
Transaction fees and commissions were 82.85% of 2025 revenue and grew 19.45% from 2024 (calculated) [2]. Subscription fees, LSEG market data fees and other revenue together were 17.15% (calculated). One line is worth noticing: LSEG market data fees, $93,197 thousand in 2025 [2]. Tradeweb has a market data license agreement with affiliates of LSEG, the group that controls it, under which LSEG distributes some Tradeweb data to its own customers [1].
How have revenue and profit changed over five years?#
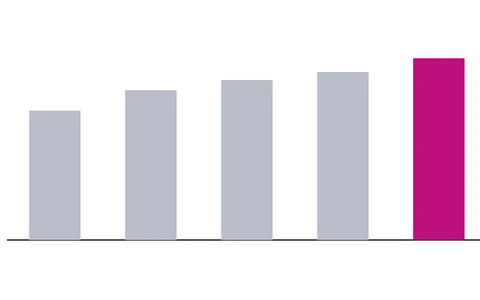
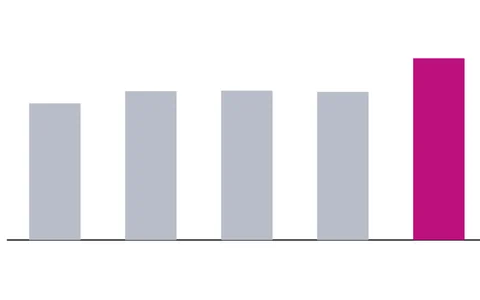
The bars above cover fiscal 2021 to fiscal 2025, each ending December 31. Revenue rose from $1.08 billion to $2.05 billion, up 90.67% (calculated). Net income attributable to Tradeweb rose from $226.8 million to $812.8 million, up 258.33% (calculated).
The last year stands out. From 2024 to 2025 revenue grew 18.92% and operating income grew 23.2%, but net income attributable to the company grew 62.07% (calculated from the figures in [2]). When net income grows much faster than operating income, the difference sits in lines below operating income, such as taxes or other income. The 10-K's management discussion explains those lines; we did not find the reason in the part of the filing we could read, so we do not state it here.
Notice that total net income ($921,500 thousand) is higher than the amount attributable to Tradeweb Markets Inc. ($812,792 thousand) [2], a gap of $108,708 thousand (calculated). The panel above uses the attributable figure. It is the one that lines up with EPS: diluted EPS of $3.78 times 214.9 million diluted shares is about $812.3 million (calculated).
What do EPS and dividends per share show?#
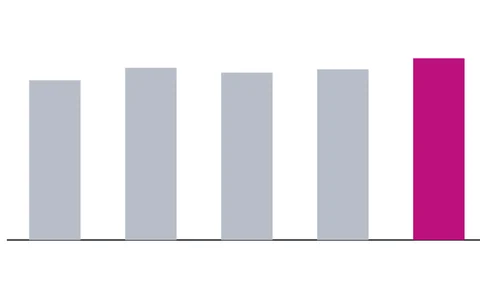
Diluted EPS went from $1.09 in fiscal 2021 to $3.78 in fiscal 2025, up 246.79% (calculated). Diluted EPS divides net income by common shares plus shares that could be created from options and similar instruments [3]. Read more on earnings per share.
Dividends declared per share rose from $0.32 to $0.48 over the same years, up 50% (calculated). The payout ratio is the dividend divided by earnings for the same period [4]: $0.48 / $3.78 = 12.7% for 2025 (calculated). In other words, most of the year's earnings per share were not paid out as dividends. See how the payout ratio works.
What risks does Tradeweb say could hurt results?#
Item 1A of a 10-K covers the most significant risks that apply to the company [5]. Tradeweb's forward-looking statements open with a list of factors that could make actual results differ. Four of the first six are [1]:
- "changes in economic, political, social and market conditions and the impact of these changes on trading volumes"
- "our failure to compete successfully"
- "our dependence on dealer clients"
- "design defects, errors, failures or delays with our platform or solutions"
Transaction fees were 82.85% of 2025 revenue (calculated above), and the company's own first factor ties market conditions to trading volumes [1]. Keep both facts in mind when you look at the revenue bars.
How should a beginner use these numbers?#
- Check what drives revenue
At Tradeweb, transaction fees are the large line. Compare their growth with subscription fees, which are a smaller share.
- Use the attributable profit
Use net income attributable to Tradeweb Markets Inc., not total net income, when you compare with EPS or calculate margins.
- Bring your own price
This page has no share price. Take the current price from your broker and divide by diluted EPS with our P/E calculator. Investor.gov's definition uses earnings for the past 12 months [6], so EPS for 2025 gives a P/E on calendar 2025, not the latest 12 months.
- Read the filing
All 10-K and 10-Q filings are public on the SEC's EDGAR website [5]. Our guide to 10-K, 10-Q and 8-K filings shows where each number sits.
Frequently asked questions#
How does Tradeweb make money?
Mostly from transaction fees and commissions, which were $1,700,427 thousand of its $2,052,429 thousand revenue in 2025. It also earns subscription fees, market data fees from LSEG and other revenue [2].
Who controls Tradeweb?
The 10-K names LSEG's control of the company and its status as a controlled company as factors that could affect results [1]. LSEG is London Stock Exchange Group.
Why are there two net income figures?
Total net income in 2025 was $921,500 thousand, and $812,792 thousand of it was attributable to Tradeweb Markets Inc. [2]. The attributable figure is the one that matches diluted EPS times diluted shares (calculated).
Does this page tell me whether to buy TW?
No. It explains what the company reported and makes no recommendation. Stocks can lose value, including companies whose revenue has grown.
The bottom line#
Tradeweb's filings show a marketplace business that earns most of its revenue from transaction fees, with revenue up 90.67% and diluted EPS up 246.79% from fiscal 2021 to fiscal 2025 (calculated from the SEC data above). The company itself lists market conditions, trading volumes and its controlling shareholder among the factors that could change its results [1]. Read the numbers with those factors in mind.
Sources
- Tradeweb Markets Inc. Form 10-K for the fiscal year ended December 31, 2025 (tw-20251231.htm).
- Consolidated Statements of Income (R5.htm), Tradeweb Markets Inc. Form 10-K for 2025.
- Financial Performance Metrics Every Investor Should Know.
- Payout ratio.
- How to Read a 10-K/10-Q | Investor.gov.
- Price-earnings (P/E) Ratio.
Where the figures come from
- SEC EDGAR XBRL company facts for Tradeweb Markets Inc. U.S. Securities and Exchange Commission, downloaded 6 Oct 2026. Annual values from Form 10-K; when a later filing restates a year, we show the latest reported value. Each fiscal year is labelled by the calendar year in which it ends.
- SEC EDGAR filing index for Tradeweb Markets Inc. Form list, filing dates and fiscal year end.
- Net margin, payout ratio, free cash flow and return on equity are calculated by ChartWise from the reported figures above, using the formula shown under each number.
Education only. This page is not investment, tax or legal advice. Stocks can lose value. See our risk disclosure.