Company snapshot · JPM
JPMorgan Chase (JPM): what its filings show
JPMorgan Chase is a bank, and a bank's financial statements do not read like those of a company that sells products. This page walks through its 2025 Form 10-K numbers in plain English, with no price, rating or opinion on the stock.
Quick answer
In 2025 JPMorgan Chase reported total net revenue of $182,447 million and net income of $57,048 million [3]. About 52% of revenue came from net interest income (calculated). For a bank, read revenue, credit-loss provisions, EPS and equity; operating cash flow swings with trading balances [9].
No share price here on purpose. Prices change every second and we do not have a licensed live feed. Look up the current price with your broker, then use our P/E calculator with the EPS below.
Key figures, fiscal year 2025 (year ended 31 Dec 2025, Form 10-K filed 13 Feb 2026)
- Revenue
- $182.45Breported
- Net income
- $57.05Breported
- Net margin
- 31.3%calculated: net income ÷ revenue
- Diluted EPS
- $20.02reported
- Dividends per share
- $5.80reported, declared
- Payout ratio
- 29.0%calculated: dividends per share ÷ diluted EPS
- Total assets
- $4.42Treported, at year end
- Shareholders' equity
- $362.44Breported, at year end
- Return on equity
- 15.7%calculated: net income ÷ year-end equity
- Shares outstanding
- 2.66Bcover page of the latest filing, 30 Jun 2026
Latest filings
| Form | Filed | Period | Document |
|---|---|---|---|
| 10-Q | 6 Aug 2026 | 30 Jun 2026 | Open on SEC.gov |
| 8-K | 23 Jul 2026 | 23 Jul 2026 | Open on SEC.gov |
| 8-K | 23 Jul 2026 | 21 Jul 2026 | Open on SEC.gov |
| 8-K | 14 Jul 2026 | 14 Jul 2026 | Open on SEC.gov |
| 8-K | 14 Jul 2026 | 14 Jul 2026 | Open on SEC.gov |
| 10-Q | 1 May 2026 | 31 Mar 2026 | Open on SEC.gov |
Key points
- JPMorgan Chase reported $4.4 trillion in assets and $362.4 billion in stockholders' equity at December 31, 2025 [1].
- Revenue has two parts: net interest income ($95,443 million in 2025) and noninterest revenue ($87,004 million) [3].
- Diluted EPS rose from $15.36 in fiscal 2021 to $20.02 in fiscal 2025, a 30.34% increase (calculated from the SEC data shown above).
- Operating cash flow was negative $147,782 million in 2025 even though net income was positive; the operating section includes a minus $156,461 million net change in trading assets [9].
- The 10-K's risk factors start with regulation, the economy and the credit of clients and counterparties [1].
On this page
What does JPMorgan Chase actually do?#
JPMorgan Chase & Co. is a financial holding company incorporated in Delaware in 1968. It had $4.4 trillion in assets and $362.4 billion in stockholders' equity as of December 31, 2025 [1]. Its main bank is JPMorgan Chase Bank, N.A., which has U.S. branches in 48 states and Washington, D.C. [1].
For reporting, the company splits itself into three business segments: Consumer & Community Banking, Commercial & Investment Bank, and Asset & Wealth Management. Everything else sits in a fourth bucket called Corporate [1].
Where does a bank's revenue come from?#
JPMorgan Chase's income statement has two revenue blocks. It lists noninterest revenue first: fees, trading results and other income. Then comes interest income minus interest expense, which is net interest income. Add the two and you get total net revenue, which is the revenue figure in the panel above [3].
JPMorgan Chase's income statement, in millions of dollars, shows how the pieces moved over three years:
| Line, $ millions | FY2025 | FY2024 | FY2023 |
|---|---|---|---|
| Net interest income | 95,443 | 92,583 | 89,267 |
| Noninterest revenue | 87,004 | 84,973 | 68,837 |
| Total net revenue | 182,447 | 177,556 | 158,104 |
| Provision for credit losses | 14,212 | 10,678 | 9,320 |
| Net income | 57,048 | 58,471 | 49,552 |
Consolidated statements of income, 2025 Form 10-K [3].
Two lines deserve a beginner's attention. First, interest income in 2025 was $193,341 million and interest expense was $97,898 million [3], so interest expense equalled 50.63% of interest income (calculated). Second, the provision for credit losses rose from $10,678 million in 2024 to $14,212 million in 2025 [3], an increase of $3,534 million or 33.1% (calculated). In the same year net income fell by $1,423 million (calculated) while total net revenue rose [3].
How have revenue and profit changed over five years?#
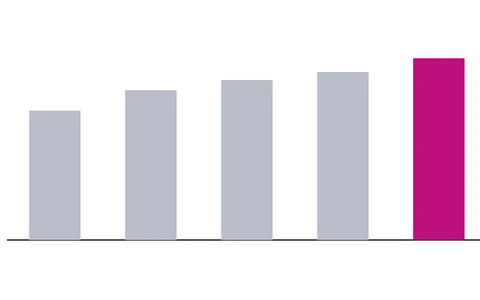
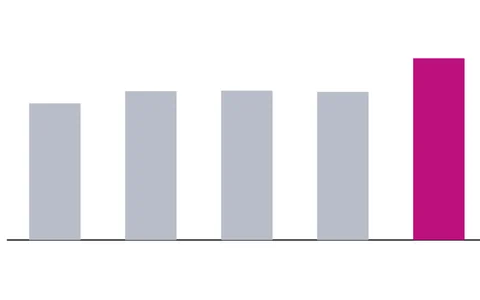
The bars above cover fiscal 2021 to fiscal 2025. Over that span total net revenue rose from $121,649 million to $182,447 million, up 49.98% (calculated). Net income grew less, from $48,334 million to $57,048 million, up 18.03% (calculated), so profit did not keep pace with revenue.
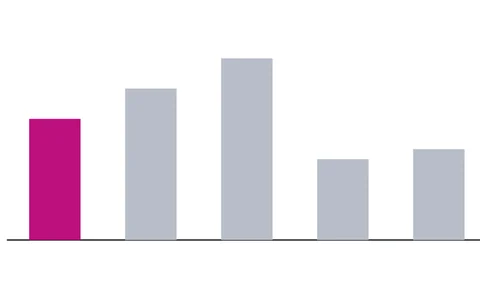
Diluted EPS climbed faster than net income: from $15.36 to $20.02, up 30.34% (calculated). Diluted EPS is net income divided by common shares plus shares that could be created from options and similar instruments [4]. The weighted diluted share count in the SEC data fell from 3,026.6 million to 2,781.5 million, down 8.1% (calculated), so each share's slice of profit grew. Learn more about earnings per share.
Dividends declared per share went from $3.80 in fiscal 2021 to $5.80 in fiscal 2025, up 52.63% (calculated). The payout ratio is the cash dividend divided by earnings for the same period [5]; for 2025 that is $5.80 / $20.02 = 28.97% (calculated). Bank dividends are also watched by regulators: in June 2020 the Federal Reserve capped large banks' dividends and barred buybacks for a quarter [6]. See how the payout ratio works.
Why does this page hide cash flow for a bank?#
A cash flow statement reports cash coming in and going out in three parts: operating, investing and financing activities [7]. The free cash flow figure on our company pages takes the operating part and subtracts capital spending, the usual way the measure is calculated [8], explained under free cash flow.
JPMorgan Chase's 2025 cash flow statement starts from net income of $57,048 million. Among the operating lines is a net change in trading assets of minus $156,461 million. The result is net cash used in operating activities of $147,782 million [9]. The year before it was negative $42,012 million, and in 2023 positive $12,974 million [9]. Deposits, meanwhile, appear under financing activities (a net change of $153,168 million in 2025), and loans appear under investing activities [9].
That is why the panel above leaves out operating and free cash flow for this company. The reported numbers are real. In our view, subtracting capital spending from an operating figure driven by trading balances would not tell a beginner much about the business.
What risks does JPMorgan Chase say could hurt results?#
Item 1A of a 10-K lists the most significant risks that apply to the company [2]. JPMorgan Chase's list opens with these themes, quoted from the 2025 filing [1]:
- Regulation: "JPMorganChase's businesses are highly regulated and are significantly affected by applicable law and supervisory expectations."
- The economy and markets: "Adverse economic and market events and conditions could negatively affect JPMorganChase's results of operations and investment and market-making positions."
- Credit: the firm "could be negatively affected by adverse changes in the financial condition of clients, counterparties, CCPs and other market participants."
- Interest rates: the risk summary names "prolonged periods of exceptionally high or low interest rates, or significant changes to interest rates."
These are the company's own words, not a forecast, and the full list in Item 1A is much longer.
How should a beginner use these numbers?#
- Split revenue in two
Check how much comes from net interest income and how much from noninterest revenue. The 10-K names interest-rate changes among its risks [1].
- Watch the provision line
The provision for credit losses is an expense line. In 2025 it rose by $3,534 million (calculated) and net income fell while revenue rose [3].
- Compare EPS, not just net income
Fewer shares can lift EPS faster than profit. For a P/E ratio, take the current price from your broker and use our P/E calculator. Investor.gov's definition uses earnings for the past 12 months [10], so EPS for 2025 gives a P/E on calendar 2025, not the latest 12 months.
- Compare like with like
Put JPMorgan Chase next to other large banks, using their own 10-K filings, rather than next to a retailer or a software company.
Frequently asked questions#
How much did JPMorgan Chase earn in 2025?
Net income was $57,048 million and diluted EPS was $20.02 for the year ended December 31, 2025, as reported in its Form 10-K [3].
Why was JPMorgan Chase's operating cash flow negative?
Because JPMorgan Chase's operating section includes changes in trading balances. In 2025 the net change in trading assets alone was minus $156,461 million, more than net income of $57,048 million [9].
Is net interest income the same as revenue?
No. Net interest income ($95,443 million in 2025) is one part. Adding noninterest revenue ($87,004 million) gives total net revenue of $182,447 million [3].
Does this page say whether JPM stock is a good buy?
No. It only explains what the company reported. Stocks can lose value, and nothing here is a recommendation to buy, sell or hold.
The bottom line#
JPMorgan Chase's filings show a bank whose total net revenue grew 49.98% from fiscal 2021 to fiscal 2025 while net income grew 18.03% (calculated from the SEC data above). Read its income statement in two halves, keep an eye on the provision for credit losses and on EPS, and do not judge a bank by operating cash flow. The full 10-K is public on the SEC's EDGAR website [2].
Sources
- JPMorgan Chase & Co. Form 10-K for the fiscal year ended December 31, 2025 (jpm-20251231.htm).
- How to Read a 10-K/10-Q | Investor.gov.
- Consolidated Statements of Income (R3.htm), JPMorgan Chase & Co. Form 10-K for 2025.
- Financial Performance Metrics Every Investor Should Know.
- Payout ratio.
- Federal Reserve Board releases results of stress tests for 2020 and additional sensitivity analyses conducted in light of the coronavirus event.
- Beginners' Guide to Financial Statements.
- Non-GAAP Financial Measures (Compliance and Disclosure Interpretations).
- Consolidated Statements of Cash Flows (R9.htm), JPMorgan Chase & Co. Form 10-K for 2025.
- Price-earnings (P/E) Ratio.
Where the figures come from
- SEC EDGAR XBRL company facts for JPMORGAN CHASE & CO. U.S. Securities and Exchange Commission, downloaded 6 Oct 2026. Annual values from Form 10-K; when a later filing restates a year, we show the latest reported value. Each fiscal year is labelled by the calendar year in which it ends.
- SEC EDGAR filing index for JPMORGAN CHASE & CO. Form list, filing dates and fiscal year end.
- Net margin, payout ratio, free cash flow and return on equity are calculated by ChartWise from the reported figures above, using the formula shown under each number.
Education only. This page is not investment, tax or legal advice. Stocks can lose value. See our risk disclosure.