Company snapshot · CVX
Chevron (CVX): what its filings show
Chevron produces oil and natural gas and refines and sells fuels and chemicals. Its earnings have swung widely from year to year, and this page reads that history from its own filings, with no share price, rating or opinion on the stock.
Quick answer
Chevron's net income was $12,299 million in 2025, down from $17,661 million in 2024 [2] and $35,465 million in 2022. Diluted EPS fell to $6.63. The company says oil, natural gas and NGL prices are the most significant factor in its results [1].
No share price here on purpose. Prices change every second and we do not have a licensed live feed. Look up the current price with your broker, then use our P/E calculator with the EPS below.
Key figures, fiscal year 2025 (year ended 31 Dec 2025, Form 10-K filed 24 Feb 2026)
- Revenue
- $189.03Breported
- Net income
- $12.30Breported
- Net margin
- 6.5%calculated: net income ÷ revenue
- Diluted EPS
- $6.63reported
- Dividends per share
- $6.84reported, declared
- Payout ratio
- 103.2%calculated: dividends per share ÷ diluted EPS
- Operating cash flow
- $33.94Breported
- Free cash flow
- $16.59Bcalculated: operating cash flow minus capital spending
- Total assets
- $324.01Breported, at year end
- Shareholders' equity
- $186.45Breported, at year end
- Return on equity
- 6.6%calculated: net income ÷ year-end equity
- Shares outstanding
- 1.98Bcover page of the latest filing, 30 Jun 2026
Latest filings
| Form | Filed | Period | Document |
|---|---|---|---|
| 8-K | 5 Oct 2026 | 30 Sep 2026 | Open on SEC.gov |
| 10-Q | 6 Aug 2026 | 30 Jun 2026 | Open on SEC.gov |
| 8-K | 31 Jul 2026 | 31 Jul 2026 | Open on SEC.gov |
| 8-K | 29 May 2026 | 27 May 2026 | Open on SEC.gov |
| 8-K | 29 May 2026 | 27 May 2026 | Open on SEC.gov |
| 10-Q | 7 May 2026 | 31 Mar 2026 | Open on SEC.gov |
Key points
- Chevron reports two main segments: Upstream (finding and producing oil and gas) and Downstream (refining and marketing) [1].
- Net income attributable to Chevron fell from $35,465 million in 2022 to $12,299 million in 2025, down 65.32% (calculated from the SEC data shown above).
- The 10-K names commodity prices as the most significant factor affecting results [1].
- Dividends per share rose every year from fiscal 2021 to fiscal 2025 in the SEC data, reaching $6.84 declared in 2025 [4], more than 2025 diluted EPS of $6.63 [2].
- Chevron acquired Hess, including Guyana assets, in July 2025 [1].
On this page
What does Chevron actually sell?#
Chevron's 10-K describes two main businesses. Upstream operations "consist primarily of exploring for, developing, producing and transporting crude oil and natural gas", plus liquefied natural gas and related activities [1]. Downstream operations "consist primarily of refining crude oil into petroleum products" and marketing them, along with renewable fuels and petrochemicals [1].
Chevron acquired Hess in July 2025, a deal that included assets in Guyana [1]. Total assets in the SEC data rose from $256,938 million at the end of 2024 to $324,012 million at the end of 2025, up 26.11% (calculated).
What does Chevron's earnings history look like?#
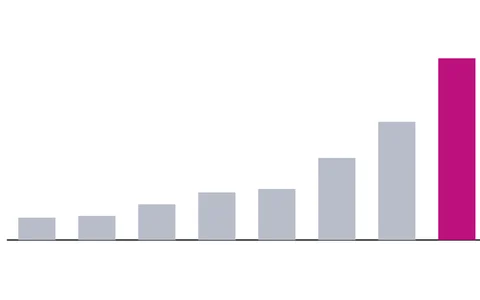
The chart above covers fiscal 2021 to fiscal 2025, each ending December 31. The table adds dividends so you can read the three together. Net income here is net income attributable to Chevron Corporation, in millions of dollars, from the SEC data above; the 2023 to 2025 figures match the 2025 Form 10-K income statement [2].
| Year | Net income, $M | Diluted EPS | Dividends/share |
|---|---|---|---|
| Fiscal 2021 | 15,625 | $8.14 | $5.31 |
| Fiscal 2022 | 35,465 | $18.28 | $5.68 |
| Fiscal 2023 | 21,369 | $11.36 | $6.04 |
| Fiscal 2024 | 17,661 | $9.72 | $6.52 |
| Fiscal 2025 | 12,299 | $6.63 | $6.84 |
SEC EDGAR company facts (Form 10-K); 2023 to 2025 checked against the 2025 Form 10-K [2].
The pattern is a sharp peak and a long slide. Net income in 2022 was 2.27 times the 2021 level (calculated), then fell three years in a row: from 2022 to 2025 it dropped 65.32% and diluted EPS dropped 63.73% (calculated). Revenue fell less, down 23.24% over the same years (calculated), so the net margin narrowed from 14.4% in 2022 to 6.51% in 2025 (calculated). The SEC data also show a net loss of $5,543 million for fiscal 2020, which is outside the five years charted above.
Why do Chevron's earnings swing so much?#
The company answers this itself. Its 10-K says: "The most significant factor that affects the company's results of operations are the prices of crude oil, natural gas, and natural gas liquids" [1]. It adds that those prices can be influenced by economic growth, production and inventory levels, OPEC and other producers' quotas, weather, geopolitical risks, the pace of energy transition and government policy [1].
The first risk factor in Item 1A makes the same point: "Chevron is exposed to the effects of changing commodity prices" [1]. In our view, that is a reason to start from the five-year table above rather than from any single year.
What do EPS and dividends per share show?#
Diluted EPS divides net income by common shares plus shares that could be created from options and similar instruments [3]. Chevron's diluted share count in the SEC data rose from 1,817 million in 2024 to 1,856 million in 2025, up 2.15% (calculated), so EPS fell slightly more than net income that year. See earnings per share explained.
Dividends per share went up every year in the table, from $5.31 in fiscal 2021 to $6.84 in fiscal 2025, up 28.81% (calculated). The SEC data give dividends paid for 2020 and 2021 and dividends declared from 2022 on. In fiscal 2020, the loss year, Chevron still paid $5.16 per share, according to the SEC data.
The payout ratio is the dividend divided by earnings for the same period [5]. Above 100% means the company declared more per share than it earned per share in that year. Operating cash flow ($33,939 million) and free cash flow, typically operating cash flow minus capital expenditures [6] ($16,592 million), were both larger than net income in 2025 (calculated from the SEC data). In our view, a dividend is best read against cash flow as well as EPS. See how the payout ratio works.
What risks does Chevron say could hurt results?#
Item 1A of a 10-K covers the most significant risks that apply to the company [7]. Chevron's first three risk factor headings in its 2025 filing are [1]:
- "Chevron is exposed to the effects of changing commodity prices"
- "The scope of Chevron's business will decline if the company does not successfully develop resources"
- "The company's operations could be disrupted by natural or human causes beyond its control"
These are the company's own words, not a forecast. The full list in Item 1A is longer, and 10-K filings are public on the SEC's EDGAR website [7].
How should a beginner use these numbers?#
- Read several years together
Chevron's net income ranged from a loss in 2020 to $35,465 million in 2022. One year is not a trend.
- Compare dividends with EPS and cash flow
In 2025 dividends per share exceeded diluted EPS. Check operating cash flow and capital spending too.
- Bring your own price
This page has no share price. Take the current price from your broker and divide by diluted EPS with our P/E calculator. Investor.gov's definition uses earnings for the past 12 months [8], so EPS for 2025 gives a P/E on calendar 2025. In our view, when earnings swing, a P/E based on one year can mislead.
- Read the 10-K yourself
Our guide to 10-K, 10-Q and 8-K filings shows where each number sits.
Frequently asked questions#
How much did Chevron earn in 2025?
Net income attributable to Chevron was $12,299 million, or $6.63 per diluted share, for the year ended December 31, 2025, as reported in its Form 10-K [2].
Why did Chevron's earnings fall after 2022?
The 10-K names oil, natural gas and NGL prices as the most significant factor in its results [1]. The filing's management discussion explains each year's changes; this page does not add its own explanation.
Did Chevron pay more in dividends than it earned in 2025?
Per share, yes: dividends declared were $6.84 against diluted EPS of $6.63, a payout ratio of 103.17% (calculated). Free cash flow was $16,592 million (calculated from the SEC data).
Is Chevron stock a buy after the drop in earnings?
This page does not say. It explains what the company reported. Stocks can lose value, and Chevron states that commodity prices are the most significant factor in its results [1].
The bottom line#
Chevron's earnings history shows a loss in 2020, a peak in 2022 and three years of decline to 2025, while dividends per share kept rising (calculated from the SEC data above). The company says commodity prices are the main driver. Read several years together, compare dividends with both EPS and cash flow, and use the 10-K for the reasons behind each year.
Sources
- Chevron Corporation Form 10-K for the fiscal year ended December 31, 2025 (cvx-20251231.htm).
- Consolidated Statement of Income (R3.htm), Chevron Corporation Form 10-K for 2025.
- Financial Performance Metrics Every Investor Should Know.
- Consolidated Statement of Equity (Parenthetical) (R9.htm), Chevron Corporation Form 10-K for 2025.
- Payout ratio.
- Non-GAAP Financial Measures (Compliance and Disclosure Interpretations).
- How to Read a 10-K/10-Q | Investor.gov.
- Price-earnings (P/E) Ratio.
Where the figures come from
- SEC EDGAR XBRL company facts for CHEVRON CORP. U.S. Securities and Exchange Commission, downloaded 6 Oct 2026. Annual values from Form 10-K; when a later filing restates a year, we show the latest reported value. Each fiscal year is labelled by the calendar year in which it ends.
- SEC EDGAR filing index for CHEVRON CORP. Form list, filing dates and fiscal year end.
- Net margin, payout ratio, free cash flow and return on equity are calculated by ChartWise from the reported figures above, using the formula shown under each number.
Education only. This page is not investment, tax or legal advice. Stocks can lose value. See our risk disclosure.